Derivative intuition module | Taking derivatives | Differential Calculus | Khan Academy
TLDRThe video script introduces a derivative intuition module by Ben Eater, which visually illustrates the concept of derivatives as the slope of the tangent line to a curve at any given point. The exercise involves adjusting orange dots to approximate the slope of the tangent line for the function f(x) = 2x^3 at various points. By doing so, viewers can visually understand the derivative's behavior, including its increase, decrease, and inflection points, without calculating it for every point. The module concludes by drawing the derivative curve, demonstrating the slope of the tangent line across the entire function.
Takeaways
- 📚 The script introduces a derivative intuition module contributed by Ben Eater, emphasizing its graphical nature and its role in conceptualizing derivatives.
- 📈 The module helps to visualize the slope of the tangent line at any point on a curve, which is the fundamental concept of a derivative.
- 🔍 The exercise involves adjusting orange dots to approximate the slope of the tangent line to the curve of the function f(x) = 2x^3.
- 🎯 By moving the orange dots, one can visually determine the derivative at specific points, such as when x = -2, where the slope is 24.
- 📉 The script illustrates how the slope of the tangent line changes along the curve, showing an increase and decrease in the rate of change.
- 🔺 At certain points, like x = 0, the slope is zero, indicating an inflection point where the curve is flat.
- 📊 The derivative at x = 0 is shown to be 0, which is a formal way of expressing that the slope of the tangent line is zero at that point.
- 📈 As x increases from 0, the script shows the slope of the tangent line increasing again, indicating a change in the rate of change.
- 📝 The exercise does not require finding the derivative at every point; instead, it focuses on special points where the orange dots can be adjusted.
- 🌐 By getting the orange dots close to the actual derivatives, the module can draw the entire curve of the derivative, representing the slope at every point.
- 🔑 The takeaway is that once the curve of the derivative is established, it provides the slope of the tangent line, or the rate of change, at any point on the original function's curve.
Q & A
What is the main purpose of the derivative intuition module?
-The main purpose of the derivative intuition module is to help conceptualize what a derivative is, which is essentially the slope of the tangent line at any given point on a curve.
Who contributed the derivative intuition module?
-The derivative intuition module was contributed by Ben Eater.
What function is graphed in the exercise?
-The function graphed in the exercise is f(x) = 2x to the third power.
What is the significance of the orange dots in the module?
-The orange dots in the module represent points on the graph where the slope of the tangent line is being analyzed. Moving these dots helps to approximate the slope of the tangent line at those points.
How is the slope of the tangent line at a point determined in the module?
-The slope of the tangent line at a point is determined by moving the orange dot until it visually appears to be as close as possible to the actual slope of the tangent line at that point on the curve.
What does the term 'DDX' represent in the module?
-In the module, 'DDX' represents the derivative of the function at a specific point, which is the slope of the tangent line at that point.
What is the derivative of the function f(x) = 2x^3 at x = -2?
-The derivative of the function f(x) = 2x^3 at x = -2 is 24, indicating that the slope of the tangent line at that point is 24.
What is an inflection point and how is it represented in the module?
-An inflection point is a point on the curve where the concavity changes. In the module, it is represented by a point where the slope of the tangent line (the derivative) is 0.
How does the slope of the tangent line change as x increases from negative to positive values in the given function?
-As x increases from negative to positive values in the function f(x) = 2x^3, the slope of the tangent line starts as very positive, decreases to 0 at an inflection point, and then starts increasing again.
What does the module demonstrate about the relationship between the derivative and the slope of the curve?
-The module demonstrates that the derivative of a function at any point is equivalent to the slope of the curve at that point, and by approximating these slopes at specific points, one can visualize the overall derivative curve.
How does the module help in understanding the concept of derivatives without calculating them explicitly?
-The module helps in understanding the concept of derivatives by providing a visual representation of the slope of the tangent line at various points on the curve, allowing users to approximate and visualize the derivative without performing explicit calculations.
Outlines
📚 Derivative Intuition Module Overview
The script introduces the 'derivative intuition module' contributed by Ben Eater, which is designed to help visualize and understand the concept of derivatives. It emphasizes the module's graphical nature and its ability to illustrate the slope of the tangent line at various points on a curve. The module is used to demonstrate the derivative of a function, specifically f(x) = 2x^3, by adjusting orange dots to approximate the slope of the tangent line at different points.
Mindmap
Keywords
💡Derivative
💡Tangent Line
💡Slope
💡Graphical
💡Module
💡Conceptualize
💡Function
💡Inflection Point
💡Approximation
💡Rate of Change
Highlights
Introduction of the derivative intuition module contributed by Ben Eater.
The module is graphical and helps conceptualize the concept of a derivative.
A derivative is defined as the slope of the tangent line at any point on a curve.
Exercise involves graphing the function f(x) = 2x^3 and adjusting orange dots to match tangent line slopes.
Initial orange dot at position 0 with a slope of 0, not matching the actual slope of the curve.
Demonstration of moving the orange dot to approximate the slope of the tangent line.
Visualization of the derivative at f(x) = -2, showing a slope of 24.
Adjusting the orange dot to find the slope at different points on the curve.
Observation that the slope decreases as x values increase from negative to positive.
Identification of an inflection point where the slope is 0.
Explanation of the derivative at f(x) = 0 being 0, indicating a flat tangent line.
Finding the derivative at f(x) = 1, where the slope begins to increase again.
The module allows drawing the curve of the derivative by getting orange dots close to actual derivatives.
The derivative curve represents the slope of the tangent line at every point on the graph.
The exercise did not require finding the derivative at every point, but at special points adjusted by the orange dots.
The graphical representation helps in understanding the concept of derivatives without complex calculations.
The module concludes with an appreciation for the intuitive exercise in understanding derivatives.
Transcripts
Browse More Related Video
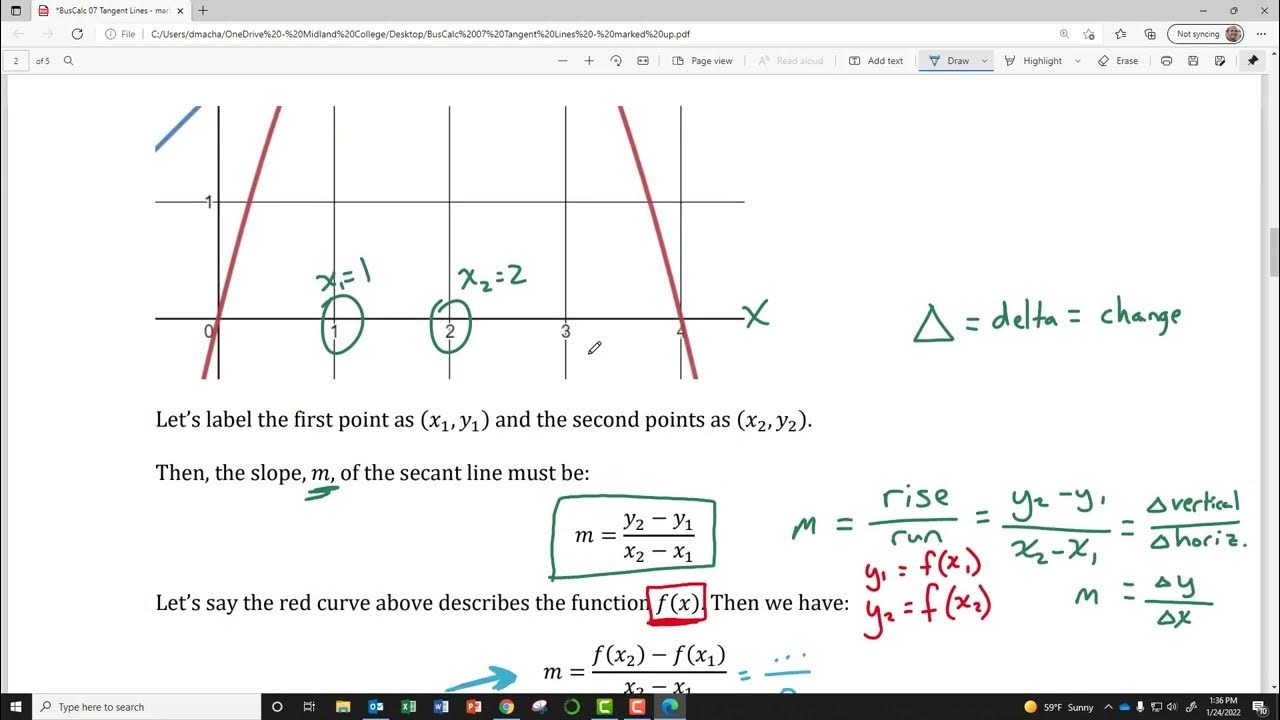
BusCalc 07 Tangent Lines

The derivative of f(x)=x^2 for any x | Taking derivatives | Differential Calculus | Khan Academy

Equation of a normal line [IB Maths AI SL/HL]
Calculating slope of tangent line using derivative definition | Differential Calculus | Khan Academy

Definition of the Derivative | Part I

Calculus | Derivatives of a Function - Lesson 7 | Don't Memorise
5.0 / 5 (0 votes)
Thanks for rating: