Supply and Demand
TLDRThe video explains the principles of supply and demand, emphasizing how these concepts determine prices of goods and services. It illustrates the law of demand, where consumers buy more as prices drop, and the law of supply, where producers offer more as prices rise. Examples, such as the varying cost of pizza slices, highlight these laws. The video also covers the substitution and income effects on demand, and how supply schedules and demand schedules can be graphically represented as curves. The intersection of these curves indicates the market equilibrium, balancing supply and demand.
Takeaways
- 🛒 Specialization is the concept that it's more efficient to purchase goods and services rather than learning to produce them.
- 💰 The price of a good or service is determined by the interaction of supply and demand.
- 📉 Demand is the relationship between the quantity of goods consumers desire and the price they are willing to pay.
- 📉 The law of demand states that as prices decrease, quantity demanded increases, and vice versa.
- 🍕 An example of demand is the varying willingness to buy a slice of pizza at different price points.
- 🔄 The substitution effect occurs when consumers switch to a substitute good when the price of a preferred good increases.
- 💼 The income effect describes the reduction in quantity demanded when prices rise, assuming income remains constant.
- 📊 A demand schedule is a table showing the quantity of a good that consumers will buy at different prices.
- 📈 The demand curve is a graphical representation of the demand schedule, typically sloping downward.
- 📦 Supply refers to the amount of a good or service that producers are willing to offer for sale.
- 📈 The law of supply indicates that producers will offer more of a good as its price increases, and less as it decreases.
- 📊 A supply schedule shows the quantity supplied at various prices, under specific conditions.
- 📈 The supply curve is an upward-sloping graph representing the supply schedule.
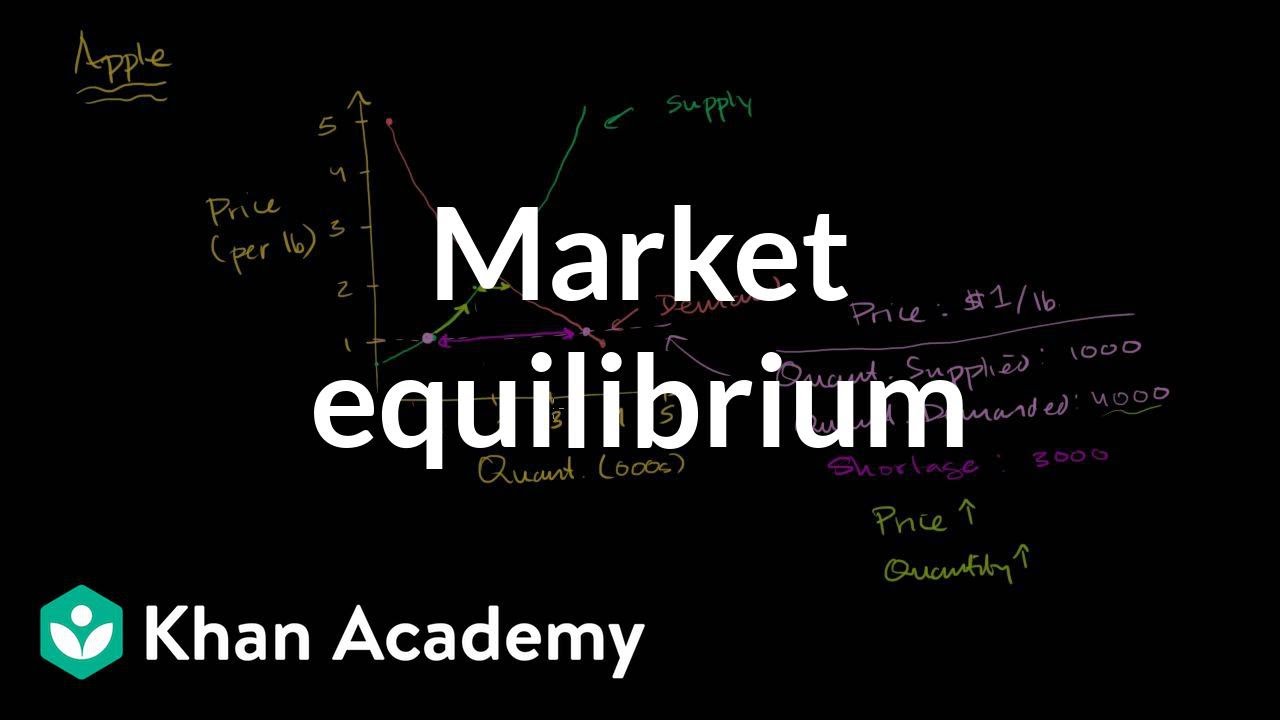
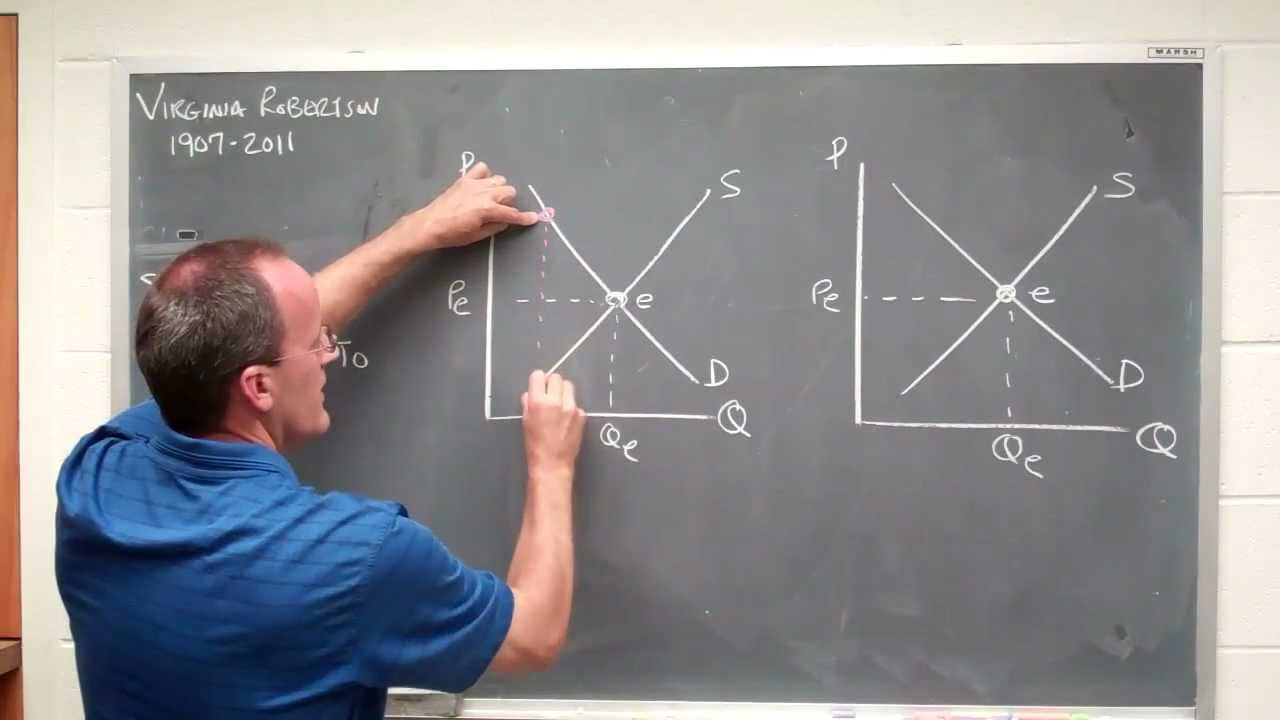
- ⚖️ Market equilibrium is the balance point where the quantity demanded equals the quantity supplied.
- 🔄 Supply and demand are dynamic and constantly shift, leading to changes in equilibrium prices.
Q & A
What is the fundamental concept of supply and demand?
-Supply and demand is an economic model that determines the price of a good or service based on the quantity available and the willingness of consumers to pay for it.
How is demand defined in the context of economics?
-Demand is the relationship between the quantities of goods and services that consumers desire and are willing to pay for at different price levels.
What does the law of demand state?
-The law of demand states that as the price of a good or service decreases, consumers will buy more of it, and as the price increases, consumers will buy less.
What is the substitution effect in economics?
-The substitution effect occurs when consumers, in response to a price increase of a good, consume less of that good and more of a similar alternative, known as a substitute.
Can you explain the income effect in the context of demand?
-The income effect refers to the decrease in quantity demanded of a good as its price rises, assuming income remains constant, making consumers feel poorer and thus reducing their purchases.
What is a demand schedule and how is it used?
-A demand schedule is a table that lists the quantity of a good that a person will buy at various prices, illustrating the relationship between price and quantity demanded.
How is the demand curve represented graphically?
-The demand curve is a downward-sloping line on a graph that represents the relationship between the price of a good and the quantity demanded, as shown in a demand schedule.
What is the law of supply and how does it relate to pricing?
-The law of supply states that producers will offer more of a good or service as its price increases, and less as its price falls, reflecting the quantity supplied at different price levels.
What is a supply schedule and how does it differ from a demand schedule?
-A supply schedule is a table that shows the quantity of a good or service a producer is willing to supply at various prices, differing from a demand schedule which shows quantities consumers are willing to buy.
How is the supply curve represented graphically?
-The supply curve is an upward-sloping line on a graph that represents the relationship between the price of a good and the quantity supplied, as depicted in a supply schedule.
What is market equilibrium and why is it significant?
-Market equilibrium is the point where the quantity demanded equals the quantity supplied, indicating a stable market where all goods and services are consumed. It is significant as it represents the balance point of supply and demand.
How do shifts in supply and demand affect market prices?
-Shifts in supply and demand cause the equilibrium price to change. An increase in demand or a decrease in supply can raise prices, while a decrease in demand or an increase in supply can lower prices.
Outlines
🛒 Understanding Demand and Supply
The first paragraph introduces the fundamental economic concepts of goods, services, and specialization, emphasizing the importance of supply and demand in determining prices. It explains that demand is the relationship between consumers' desire to purchase goods or services and their willingness to pay at different price levels. The law of demand is highlighted, which states that as prices decrease, consumers tend to buy more, and vice versa. The paragraph also discusses the substitution effect, where consumers switch to alternatives when the price of a good increases, and the income effect, which occurs when rising prices lead to a reduction in purchases if income remains constant. A demand schedule and demand curve are introduced as tools to visualize the quantity demanded at various prices, setting the stage for a deeper exploration of supply dynamics in the subsequent paragraph.
📈 The Dynamics of Supply and Market Equilibrium
The second paragraph delves into the concept of supply, which is the amount of goods or services available in the market. It explains that producers are influenced by the law of supply, increasing the quantity supplied as prices rise and decreasing it as prices fall. The paragraph uses a pizza shop example to illustrate how higher prices can motivate producers to increase production to capitalize on higher profits. A supply schedule and supply curve are introduced, showing how the quantity supplied changes with price. The paragraph concludes by discussing market equilibrium, the point where the quantity demanded equals the quantity supplied, leading to market stability. It also touches on how shifts in supply and demand can cause changes in equilibrium prices, which is a common occurrence in dynamic market conditions.
Mindmap
Keywords
💡Goods and services
💡Specialization
💡Supply and demand
💡Law of demand
💡Substitution effect
💡Income effect
💡Demand schedule
💡Supply schedule
💡Equilibrium price
💡Market equilibrium
Highlights
Goods and services are easier to purchase than to produce oneself due to specialization.
Price determination for goods and services is based on supply and demand.
Demand is the relationship between consumer desire and willingness to pay at different prices.
The law of demand states that lower prices lead to higher quantities purchased.
Consumer decisions are influenced by price and ability to pay.
Substitution effect occurs when consumers switch to substitutes due to price increases.
Income effect describes reduced purchases due to rising prices without income increase.
Demand schedule is a table listing quantities consumers will buy at various prices.
Demand curve is a graphical representation of the demand schedule.
Supply is the amount of a good or service available, influenced by price.
Quantity supplied illustrates how much producers are willing to sell at specific prices.
Producers increase supply as prices rise to take advantage of higher revenues.
Supply schedule shows the relationship between price and quantity supplied.
Supply curve is an upward sloping graph representing the supply schedule.
Market equilibrium is the balance point where quantity demanded equals quantity supplied.
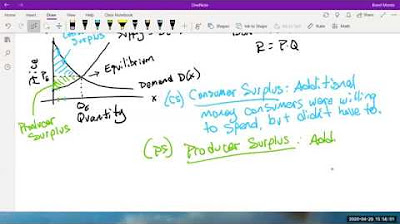
Equilibrium price is the point where demand and supply curves intersect.
Supply and demand constantly shift, leading to changes in equilibrium levels and prices.
Transcripts


5.0 / 5 (0 votes)
Thanks for rating: