Graphing basketball binomial distribution | Probability and Statistics | Khan Academy
TLDRThis video script guides viewers through visualizing a binomial probability distribution, specifically for the number of successful free throws made with a 70% success rate. The host encourages drawing a histogram to understand the distribution's shape, scales the y-axis from 0% to 40%, and the x-axis for values 0 to 6, representing the number of free throws made. The script details the probabilities for each outcome, from 0.1% for zero successful throws to 32.4% for four, and illustrates how the distribution changes with different success rates or numbers of attempts. The exercise aims to make the abstract concept of binomial distribution more tangible and interactive.
Takeaways
- 🏀 The video discusses the probability distribution of a random variable representing the number of successful free throws made out of a certain number of attempts.
- 🎯 The assumption is a 70% free throw percentage, which means a 0.7 probability of making a free throw and a 0.3 probability of missing.
- 📈 The video suggests visualizing this probability distribution through a graph, specifically a binomial probability distribution graph.
- 📊 The graph is a histogram that shows the probability of making 0 to 6 free throws, given the 70% success rate.
- 📝 The video provides a step-by-step guide on how to draw the histogram, including setting up the axes and plotting the probabilities.
- 📉 The probabilities for each outcome are given, starting from 0.1% for making 0 free throws to 32.4% for making 4 free throws.
- 📚 The shape of the binomial distribution is visualized, showing how it changes with different numbers of attempts or success rates.
- 🤔 The video encourages viewers to think about how changes in the free throw percentage or the number of shots taken would affect the distribution.
- 🛠️ It is suggested that viewers can use a spreadsheet to experiment with different values and see how the binomial distribution changes.
- 📊 The histogram is a useful tool for visualizing the distribution and understanding the likelihood of different outcomes.
- 💡 The exercise is an educational demonstration of how to create and interpret a binomial distribution histogram.
Q & A
What is the main topic discussed in the video script?
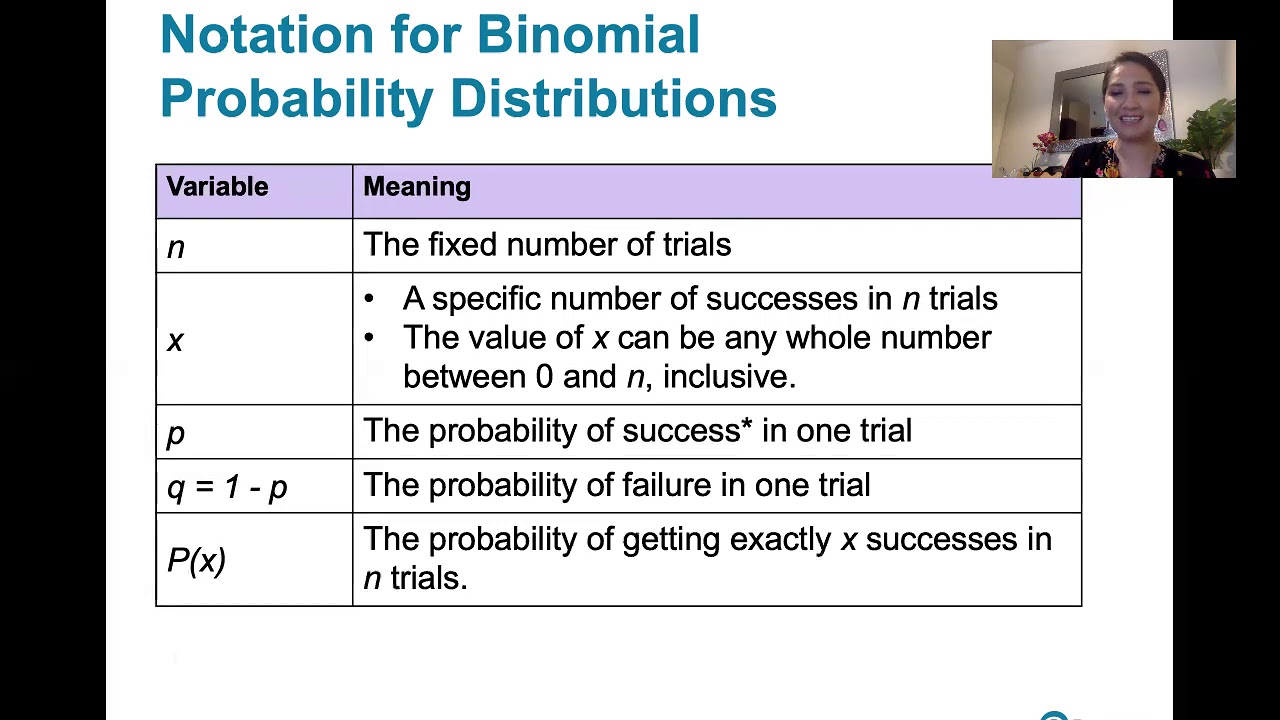
-The main topic discussed in the video script is the probability distribution of a binomial random variable, specifically the number of successful free throws made out of a certain number of attempts, given a 70 percent free throw percentage.
What is the purpose of visualizing the binomial probability distribution?
-Visualizing the binomial probability distribution helps to make the concept more tangible and understandable, allowing viewers to see the shape of the distribution and how it changes with different parameters.
What is the free throw percentage used in the script for the binomial probability distribution?
-The free throw percentage used in the script for the binomial probability distribution is 70 percent.
How many free throws are considered in the video script for the binomial distribution?
-The number of free throws considered in the video script is not explicitly stated, but it is implied to be a scenario where the random variable can take on values from zero to six.
What does the video script suggest to do with the binomial distribution graph?
-The video script suggests graphing the binomial distribution to visualize its shape and to understand how the distribution changes with different free throw percentages or numbers of shots taken.
What is the highest percentage shown on the graph in the video script?
-The highest percentage shown on the graph in the video script is a little over 32 percent.
How does the video script describe the process of graphing the binomial distribution?
-The video script describes the process of graphing the binomial distribution step by step, starting with setting up the axes for percentages and values the random variable can take, and then plotting and shading the probabilities for each value.
What is the significance of the percentages 18.5%, 32.4%, 30.3%, and 11.8% mentioned in the script?
-The percentages 18.5%, 32.4%, 30.3%, and 11.8% represent the probabilities of making three, four, five, and six free throws, respectively, given the 70 percent free throw percentage and the binomial distribution.
What tool can be used to explore how the binomial distribution changes with different parameters?
-A spreadsheet can be used to explore how the binomial distribution changes with different free throw percentages or numbers of shots taken.
What is the educational value of creating a histogram for the binomial distribution as described in the script?
-Creating a histogram for the binomial distribution helps in visualizing the distribution, understanding the probabilities of different outcomes, and seeing how changes in parameters affect the shape and probabilities of the distribution.
Outlines
📊 Visualizing Binomial Distribution of Free Throws
The video script begins with a recap of the previous video, which covered the probability distribution for a random variable representing the number of successful free throws out of a given number of attempts, assuming a 70% success rate. The speaker encourages viewers to visualize this distribution by drawing a graph. The script then describes the process of creating a binomial probability distribution graph, including setting up axes with percentages on one and values of the random variable (number of successful free throws) on the other. The graph is populated with the probabilities of making zero to six free throws, with the highest probability at 32.4% for making three free throws. The speaker suggests that this visual exercise helps in understanding the distribution and encourages viewers to explore how changes in the free throw percentage or the number of attempts affect the distribution, hinting at the use of spreadsheets for such exploration.
Mindmap
Keywords
💡Probability Distribution
💡Random Variable
💡Free Throw Percentage
💡Binomial Probability Distribution
💡Graph
💡Histogram
💡Percentage
💡Spreadsheet
💡Success Rate
💡Visualize
💡Shape
Highlights
Introduction of a probability distribution for a random variable representing the number of successful free throws.
Assumption of a 70 percent free throw percentage in the model.
Suggestion to visualize the binomial probability distribution through graphing.
Explanation of the importance of graphing for visual understanding of distribution shapes.
Decision to graph the binomial distribution together with the audience.
Description of setting up the graph with percentage scales and values the random variable can take.
Identification of the highest percentage on the graph as just over 32 percent.
Detailing the process of drawing the graph with different percentages and values.
Graphing the probability of making zero free throws as barely registering on the graph.
Incremental graphing of probabilities for making one, two, and three free throws.
Highlighting the peak probability at 32.4 percent for making four free throws.
Demonstration of the decrease in probability for making five and six free throws.
Discussion on the practical application of graphing for understanding binomial distributions.
Invitation to explore how changes in free throw percentage or number of shots affect the distribution.
Suggestion to use a spreadsheet to experiment with different parameters of the binomial distribution.
Emphasis on the educational value of visualizing statistical distributions through graphing.
Transcripts
Browse More Related Video

Free throw binomial probability distribution | Probability and Statistics | Khan Academy

Generalizing k scores in n attempts | Probability and Statistics | Khan Academy
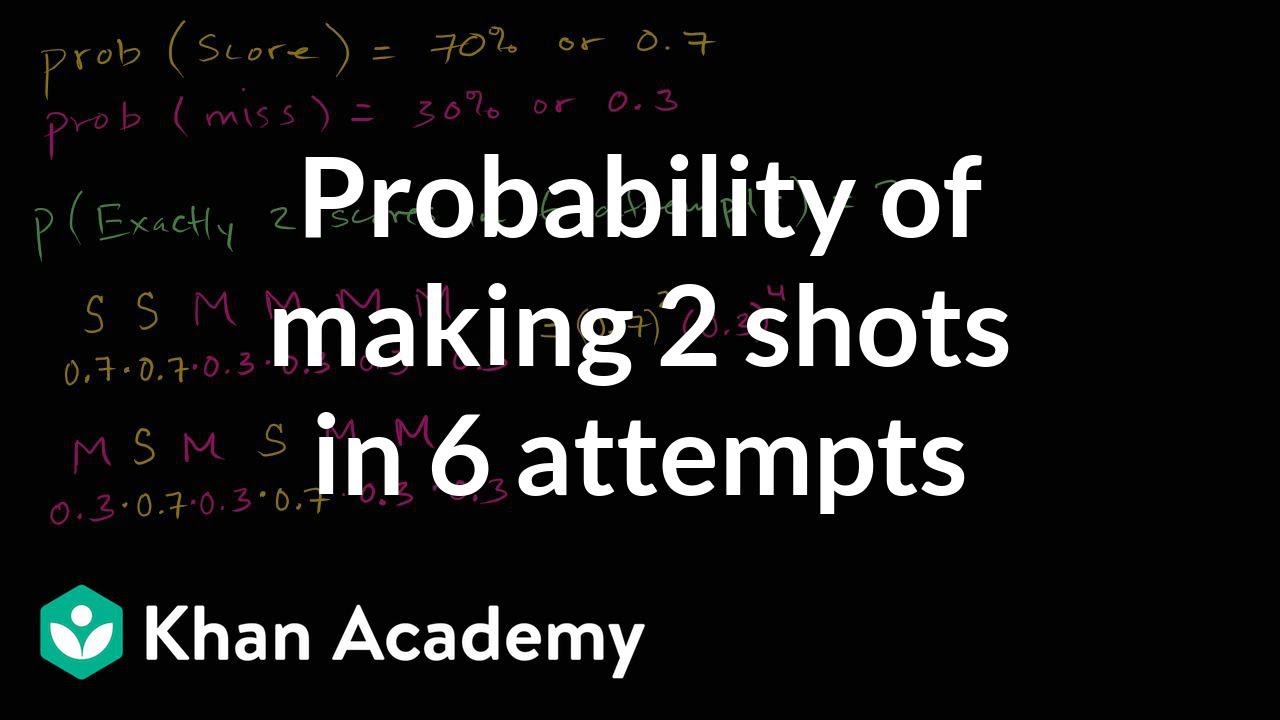
Probability of making 2 shots in 6 attempts | Probability and Statistics | Khan Academy

Binomial distribution | Probability and Statistics | Khan Academy

Visualizing a binomial distribution | Probability and Statistics | Khan Academy
5.2.1 Binomial Probability Distributions - Is this procedure described by a binomial distribution?
5.0 / 5 (0 votes)
Thanks for rating: