Free throw binomial probability distribution | Probability and Statistics | Khan Academy
TLDRThis educational video script explores the concept of a binomial distribution using the example of making free throws in basketball. It defines a random variable X as the number of successful shots out of six attempts, assuming a 70% success rate. The script calculates the probabilities for different outcomes, demonstrating how to use combinations and powers to find the likelihood of making zero to six shots. It highlights the asymmetry in the distribution due to the higher probability of making a shot, contrasting with a fair coin flip. The video encourages viewers to plot the distribution to visualize the concept, providing a clear and engaging explanation of binomial probabilities.
Takeaways
- 🏀 The video discusses a scenario involving multiple free throws and aims to define a random variable X based on the number of successful shots made out of six attempts.
- 📊 The video introduces the concept of a binomial distribution, which is used to model the probability of a number of successes in a fixed number of trials, under certain conditions.
- 🎯 The assumption made is that each free throw has a 70% chance of being successful, which is used to calculate the probabilities of different outcomes.
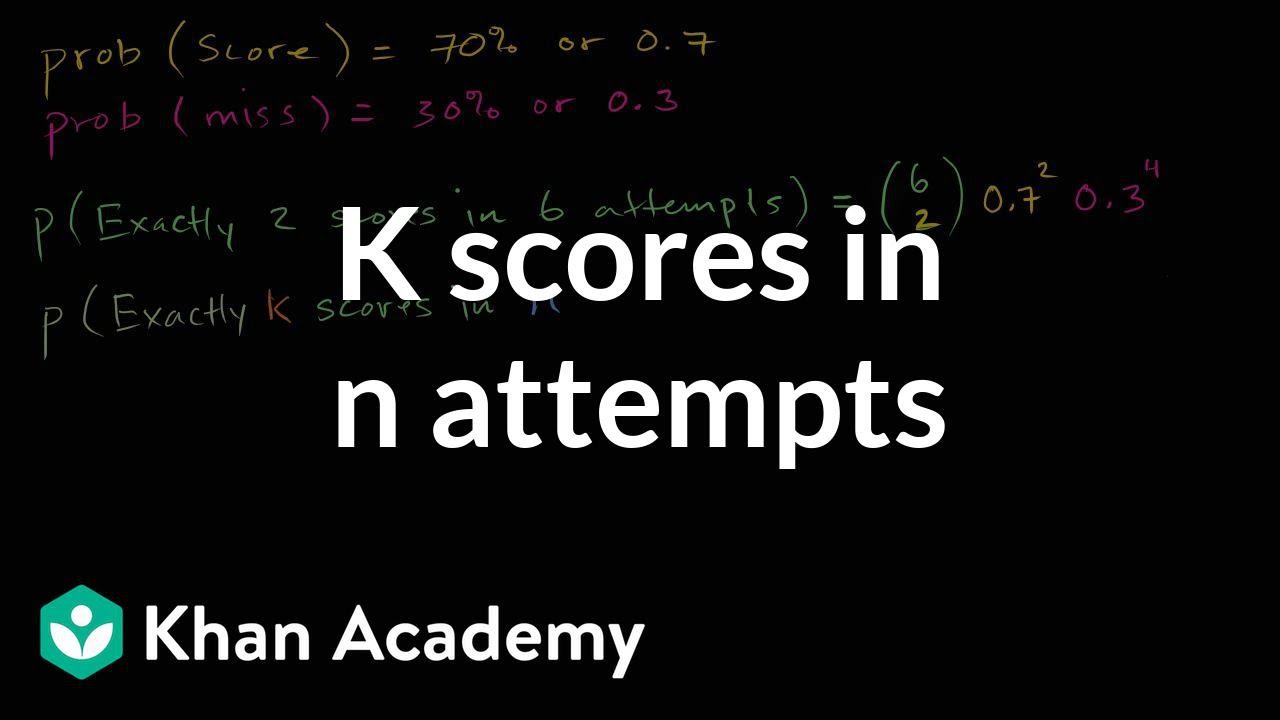
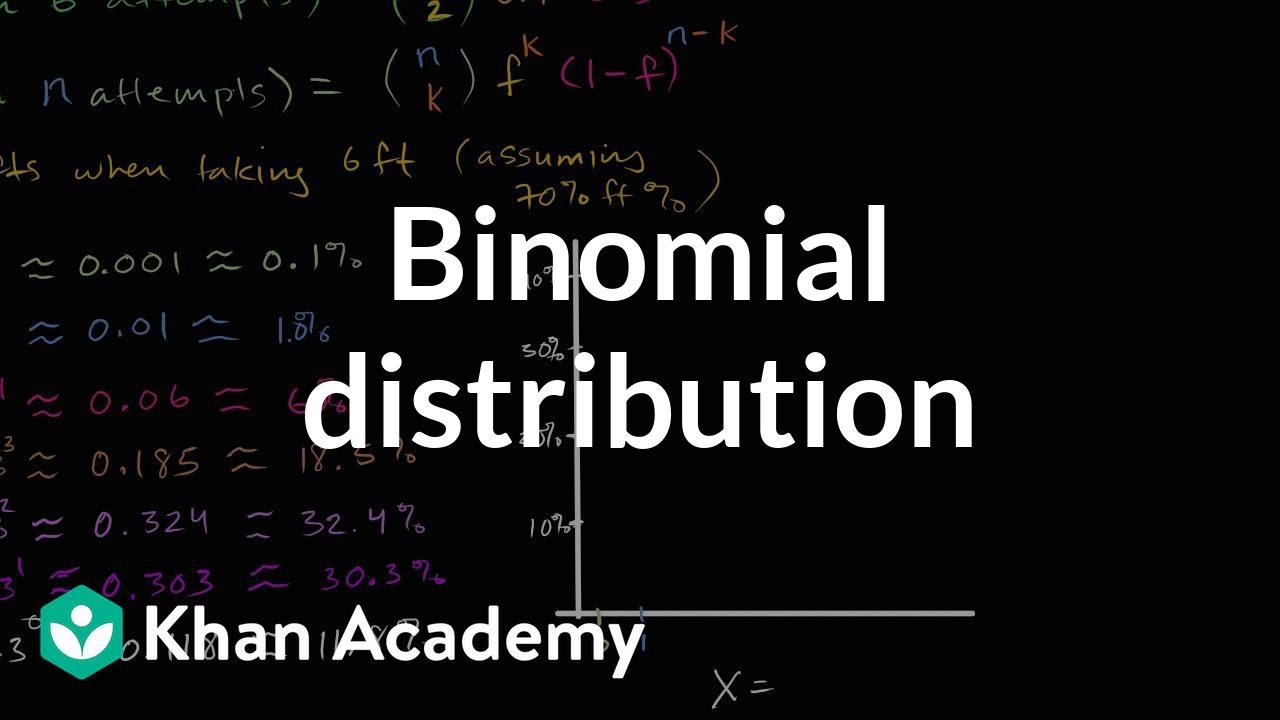
- ⚖️ The video uses the binomial probability formula to calculate the likelihood of making 0 to 6 free throws, demonstrating how to apply the formula step by step.
- 🔢 The script provides a detailed calculation for the probability of making exactly 0, 1, 2, 3, 4, 5, and 6 free throws, showing the mathematical process involved.
- 📉 The probabilities calculated show a non-symmetric distribution, which is attributed to the fact that the success rate (70%) is higher than the failure rate (30%).
- 📊 The coefficients of the binomial distribution (e.g., six choose one, six choose two, etc.) exhibit symmetry, but the actual probabilities do not due to the weighting by the success rate.
- 📈 The video highlights the increasing probability of making more free throws up to a certain point (four out of six), after which the probability decreases.
- 📊 The video encourages viewers to plot the probability distribution to visualize the distribution of the random variable X, emphasizing the importance of visual aids in understanding statistical concepts.
- 🧩 The script concludes by emphasizing that the random variable X can only take on specific values (0 to 6), and provides the calculated probabilities for each possible value.
- 📚 The video serves as an educational resource for understanding the binomial distribution and its application to real-world scenarios, such as sports statistics.
Q & A
What is the main topic discussed in the video script?
-The main topic discussed in the video script is the concept of a binomial distribution, specifically using the scenario of making free throws in basketball to define and construct the probability distribution of a random variable.
What is the random variable X defined as in the script?
-In the script, the random variable X is defined as the number of made free throws when taking six free throws.
What assumption is made about the free throw percentage in the scenario?
-The assumption made about the free throw percentage in the scenario is that it is 70%.
How is the probability of making zero free throws calculated in the script?
-The probability of making zero free throws is calculated using the formula 'six choose zero' times 0.7 to the power of zero times 0.3 to the power of six, which simplifies to 0.3 to the power of six.
What is the approximate probability of missing all six free throws?
-The approximate probability of missing all six free throws is about 0.1%, or roughly one in a thousand.
What is the probability of making exactly one free throw out of six?
-The probability of making exactly one free throw out of six is approximately 1%.
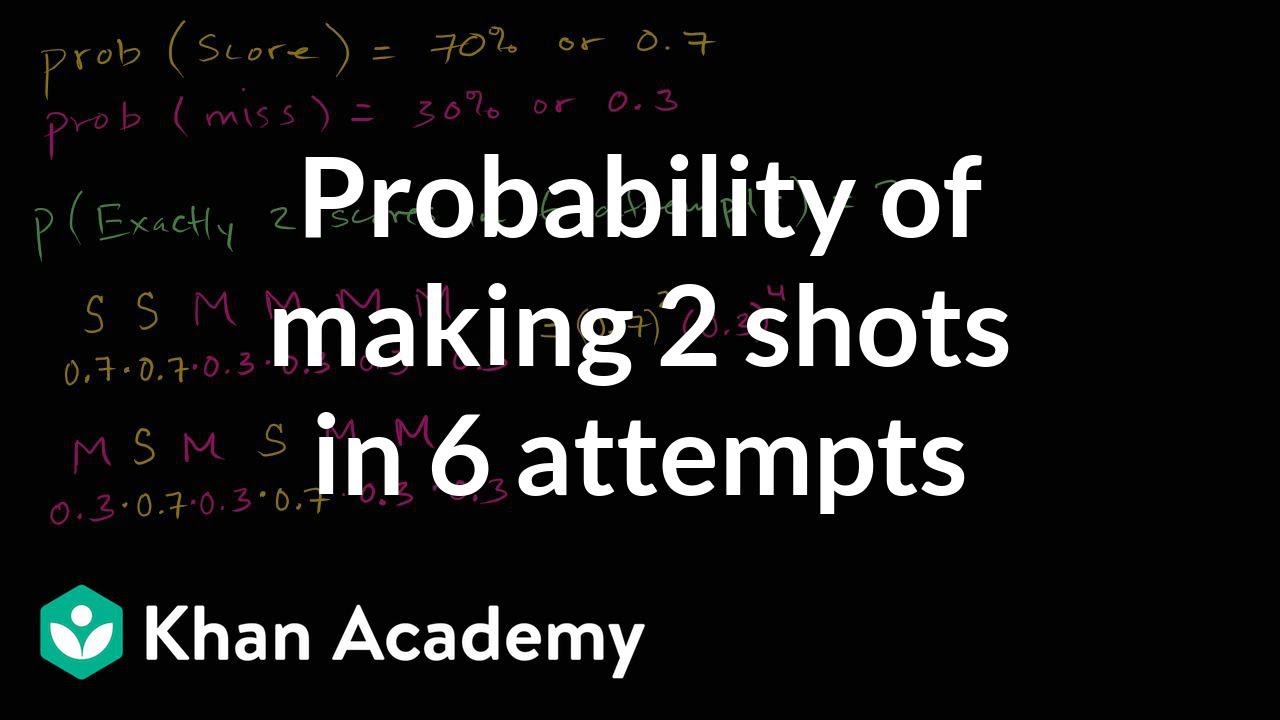
How is the probability of making exactly two free throws calculated?
-The probability of making exactly two free throws is calculated using 'six choose two' times 0.7 squared times 0.3 to the fourth power, which is approximately 6%.
What is the probability of making exactly three free throws out of six?
-The probability of making exactly three free throws out of six is approximately 18.5%.
What is the significance of the binomial coefficients in the script?
-The binomial coefficients, such as 'six choose zero' and 'six choose six', are significant because they show the symmetry in the binomial distribution when the probabilities are equal (e.g., a fair coin flip). However, in this scenario, the coefficients are weighted by the fact that making a free throw is more likely than missing, which affects the distribution's shape.
How does the video script suggest visualizing the probability distribution of the random variable?
-The video script suggests plotting the different cases of the random variable against their respective probabilities to visualize the probability distribution.
What is the probability of making exactly four free throws out of six?
-The probability of making exactly four free throws out of six is approximately 32.4%.
What is the probability of making exactly five free throws out of six?
-The probability of making exactly five free throws out of six is approximately 30.3%.
What is the probability of making all six free throws?
-The probability of making all six free throws is approximately 11.8%.
Why is there no symmetry in the probabilities as seen in a fair coin flip scenario?
-There is no symmetry in the probabilities because the free throw probability is 70%, which means making a free throw is more likely than missing. If the probability were 50%, similar to a fair coin flip, then the symmetry would be observed.
Outlines
🏀 Introduction to Binomial Distribution with Free Throws
The video begins by introducing a scenario involving multiple free throws to define a random variable and explore its probability distribution, specifically a binomial distribution. The random variable X is defined as the number of successful free throws made out of six attempts. The video assumes a 70% success rate for each throw. The presenter then calculates the probability of making no shots (X=0), using the binomial probability formula, which results in approximately a 0.1% chance of missing all six shots. The explanation is geared towards understanding the concept of binomial distribution through a relatable example.
📊 Calculating Probabilities for Different Outcomes in Binomial Distribution
Continuing from the introduction, the video script delves into calculating the probabilities for different values that the random variable X can take on, using the binomial distribution formula. The probabilities for making 1, 2, 3, 4, 5, and all 6 shots are computed sequentially. The presenter provides rough estimates for these probabilities, such as approximately 1% for making exactly one shot, 6% for two shots, 18.5% for three shots, 32.4% for four shots, 30.3% for five shots, and 11.8% for making all six shots. The video highlights the asymmetry in the distribution due to the higher probability of making a shot compared to missing one, which contrasts with the symmetry seen in the binomial coefficients. The script concludes by encouraging viewers to plot these probabilities to visualize the distribution and understand the behavior of the random variable X in this specific scenario.
Mindmap
Keywords
💡Random Variable
💡Binomial Distribution
💡Free Throw Probability
💡Probability
💡Six Free Throws
💡Made Shots
💡Combination (n choose k)
💡Power (to the zeroth, first, etc.)
💡Symmetry
💡Coefficients
💡Probability Distribution
Highlights
Introduction to defining a random variable X for the number of successful free throws in six attempts.
Assumption of a 70% free throw success rate for the probability calculations.
Explanation of how to calculate the probability of making zero free throws.
Approximation of the probability of missing all six free throws as 0.1%.
Calculation of the probability of making exactly one free throw, resulting in approximately 1%.
Probability of making two free throws is calculated to be around 6%.
Detailed calculation of the probability for making three free throws, resulting in 18.5%.
Approximation of the probability of making exactly four free throws as 32.4%.
Calculation showing a 30.3% chance of making five out of six free throws.
Probability of making all six free throws is approximately 11.8%.
Discussion on the lack of symmetry in the binomial distribution due to the 70% success rate.
Explanation of the symmetry present in the binomial coefficients.
Encouragement to plot the probability distribution for a visual understanding.
Final summary of the probability distribution for the random variable X.
Emphasis on the unique values the random variable can take on and their associated probabilities.
Transcripts
Browse More Related Video

Binomial distribution | Probability and Statistics | Khan Academy
Generalizing k scores in n attempts | Probability and Statistics | Khan Academy
Graphing basketball binomial distribution | Probability and Statistics | Khan Academy
Probability of making 2 shots in 6 attempts | Probability and Statistics | Khan Academy

Visualizing a binomial distribution | Probability and Statistics | Khan Academy

Constructing a probability distribution for random variable | Khan Academy
5.0 / 5 (0 votes)
Thanks for rating: