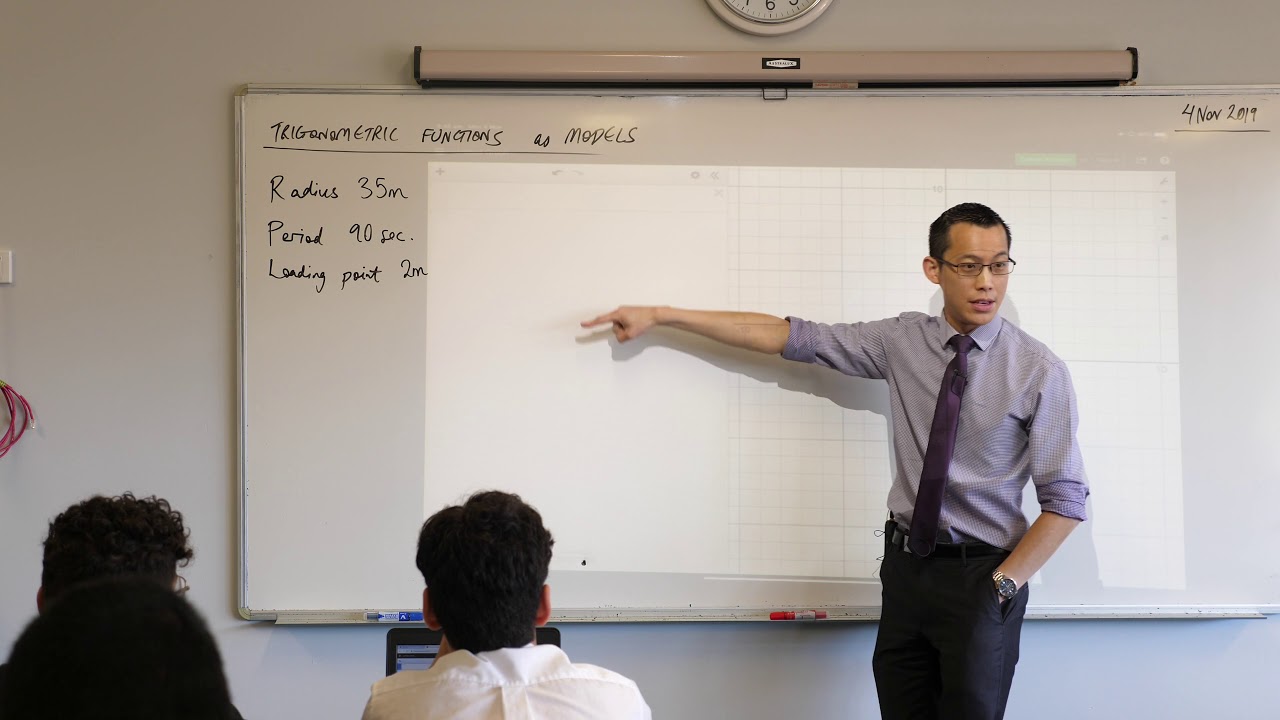
The Ferris Wheel - Trigonometric Function Model (3 of 3: Interpreting results)
TLDRThe video script discusses the construction of a cosine function graph using Desmos, specifically tailored to represent a Ferris wheel's cabin motion over a three-minute period. The instructor emphasizes the importance of accurately plotting the graph, including marking key times such as the highest and lowest points. They guide viewers through the process of finding the cabin's height above the ground after 30 seconds, using the cosine function and correcting a mistake in the graph's scale. The video also stresses the significance of interpreting answers correctly and providing them with a clear explanation, as well as the need to memorize exact values for trigonometric functions to improve calculation speed and accuracy.
Takeaways
- 📈 The script discusses a graph that models a cosine function, specifically for the first three minutes of motion, which is represented as 180 seconds on the time axis.
- 📏 The graph includes specific time markers at 45 and 135 seconds, which are important for understanding the motion's highest point.
- 📍 The instructor mentions the use of a line along the bottom of the graph to accurately determine the lowest point of the graph, despite it not being mandatory.
- 🔢 The top value of the graph is 72, derived from a radius of 35, leading to a diameter of 70, which is why it was doubled.
- 📉 The middle spot on the graph is marked as 30, indicating an addition of 37 to the basic cosine function model.
- 🤔 The instructor asks for feedback on the graph's accuracy, receiving a four-star rating, suggesting it is mostly correct but could be improved.
- 🧐 The script moves on to a question about the height of a cabin on a Ferris wheel after 30 seconds, prompting a detailed explanation of how to find the answer using the graph.
- 🔍 The instructor identifies a mistake in the graph's scale and corrects it to better match the expected values.
- ✅ The equation used to calculate the cabin's height is detailed, including the use of the cosine function with the appropriate time value and constants.
- 📚 The importance of knowing exact values for trigonometric functions, such as cos(2π/3), is emphasized for quick and accurate calculations without a calculator.
- 📝 The final answer for the cabin's height after 30 seconds is given as 54.5 meters, highlighting the need to interpret and provide answers in a clear and contextual manner.
Q & A
What is the main topic discussed in the video script?
-The main topic discussed in the video script is the modeling and analysis of a cosine function graph related to the motion of a cabin on a Ferris wheel, specifically focusing on its height above the ground over time.
What is the significance of the first three minutes in the context of the graph?
-The first three minutes are significant because they represent the time period of interest for the graph, starting at time zero and ending at 180 seconds, which corresponds to one full period of motion.
Why are the times 45 and 135 seconds important on the graph?
-The times 45 and 135 seconds are important because they mark the points on the graph where the cabin reaches its highest and lowest points, respectively.
What is the role of the line down the bottom of the graph?
-The line down the bottom of the graph is included to help accurately determine the bottom point of the graph, ensuring that the viewer knows where the lowest point of the cabin's motion is.
What is the radius and diameter of the Ferris wheel as mentioned in the script?
-The radius of the Ferris wheel is 35 units, which implies a diameter of 70 units.
What is the significance of the number 37 in the context of the graph?
-The number 37 is significant because it represents an addition made to the graph, possibly to adjust for the height of the Ferris wheel's axis above the ground.
What is the equation used to calculate the cabin's height above the ground after 30 seconds?
-The equation used is h = -35 cos((2π/3)t) + 37, where t is the time in seconds, and the equation accounts for the cosine function of the motion and the additional height of 37 units.
What is the value of cos(2π/3) and how does it relate to the graph?
-The value of cos(2π/3) is -1/2. This value is used in the equation to determine the cabin's height at specific times, indicating that at 30 seconds, the cabin is at a lower point in its cycle due to the negative cosine value.
What is the height of the cabin above the ground after 30 seconds according to the calculations?
-After 30 seconds, the height of the cabin above the ground is 54.5 meters, as calculated using the provided equation and the value of cos(2π/3).
Why is it important to interpret the answer to the question about the cabin's height?
-It is important to interpret the answer because it provides context and understanding to the numerical result. Interpretation helps to clarify whether the height is above or below a certain reference point, which is crucial for understanding the physical situation being modeled.
What does the instructor emphasize about learning exact values of trigonometric functions?
-The instructor emphasizes that learning and committing to memory the exact values of trigonometric functions, such as cos(2π/3), is important because it makes calculations faster and helps in verifying the correctness of calculator results.
Outlines
📈 Desmos Graph Analysis and Model Adjustment
The speaker discusses a graph they expect to see on their pages, which is produced in Desmos. They mention that a cosine function in Desmos continues indefinitely, but for their purposes, they only need the first three minutes of the graph. The time axis starts at zero and ends at 180 seconds, representing a full period of motion. The speaker highlights the importance of marking specific times on the graph, such as 45 and 135 seconds, which correspond to the highest point of the graph. They also discuss the necessity of having a line at the bottom of the graph to accurately determine the lowest point. Additionally, the speaker explains the significance of the numbers 72 and 37 in relation to the graph's amplitude and the addition made to the graph, respectively. They conclude by asking if the graph is good enough, to which they receive a positive response with a four-star rating.
📚 Calculating the Cabin's Height on a Ferris Wheel
The speaker moves on to a question about calculating the height of a cabin on a Ferris wheel above the ground after 30 seconds. They use a graph with marked times at 0, 45, and 90 seconds to estimate the height. The speaker realizes they made a mistake with the scale of the graph and corrects it to better represent the height. They then proceed to use an equation to find the exact height, which involves a cosine function with a time variable and additional constants. The speaker calculates the height by substituting the time value into the equation, considering the amplitude and phase shift. They find that the height is 54.5 meters above the ground and emphasize the importance of interpreting the answer correctly and providing it in a sentence. The speaker also discusses the importance of learning and memorizing exact values for trigonometric functions to improve calculation speed and accuracy.
Mindmap
Keywords
💡Graph
💡Cosine Function
💡Desmos
💡Time Axis
💡Period of Motion
💡Max and Min Points
💡Radius
💡Diameter
💡Equation
💡Gradient
💡Interpretation
Highlights
Desmos is used to create a cosine function model, but it continues indefinitely unlike the specific time frame needed.
The graph is focused on the first three minutes, starting at time zero and ending at 180 seconds.
The graph has marked times at 45 and 135 seconds, which are significant for understanding the motion's highest point.
The bottom line of the graph is included for accuracy, despite not being mandatory.
The top value of the graph is 72, derived from the radius of 35 and a diameter of 70.
The middle spot on the graph is at 30 seconds, with an addition of 37 for a specific reason.
The graph's quality is evaluated with a four-star rating, indicating room for improvement.
The height of the cabin above the ground after 30 seconds is calculated using a specific equation.
The equation includes a cosine function with time and a constant addition of 37.
The value of cos(2π/3) is discussed, and its importance in the calculation is emphasized.
The final calculated height of the cabin is 54.5 meters after 30 seconds.
The importance of interpreting the answer with a sentence is highlighted for clarity.
The need to learn and remember exact values for trigonometric functions is discussed.
A method to verify calculations without a calculator by knowing exact values is suggested.
The final answer for part c of the problem is shown, emphasizing the reasoning behind the solution.
The significance of showing the complete reasoning process in problem-solving is discussed.
Transcripts
Browse More Related Video
5.0 / 5 (0 votes)
Thanks for rating: