Learn How to Graph a Hyperbola | Graphing Hyperbola with Center at the Origin
TLDRIn this educational video, the instructor demonstrates how to graph a hyperbola centered at the origin. The process involves rewriting the equation into standard form, identifying the hyperbola's orientation as vertical, and calculating key parameters such as 'a', 'b', and 'c'. The video then explains how to determine the vertices and the length of the transverse axis. Furthermore, it provides the equations for the asymptotes and guides viewers through sketching the hyperbola, including the use of the asymptotes to form the graph. The video concludes with a call for questions and clarifications, inviting engagement from the audience.
Takeaways
- 📚 The video is a tutorial on graphing a hyperbola with its center at the origin.
- 🔍 The process begins by rewriting the equation of the hyperbola into standard form.
- 📐 The standard form of a hyperbola is \( \frac{y^2}{a^2} - \frac{x^2}{b^2} = 1 \).
- 📈 The hyperbola in the video opens vertically, indicated by a negative term in the standard equation.
- 📝 The values of 'a', 'b', and 'c' are identified from the standard form equation.
- 📌 'a' is determined to be 2 by taking the square root of the denominator under 'y^2'.
- 🧭 'b' is found to be 1 by recognizing that 'b^2' is the denominator under 'x^2'.
- 📉 'c' is calculated using the formula \( c^2 = a^2 + b^2 \), resulting in \( c = \sqrt{5} \).
- 📍 The vertices of the hyperbola are at (0, ±2), derived from the 'a' value.
- 📏 The length of the transverse axis is 4 units, which is 2 times 'a'.
- 📈 The equations of the asymptotes are \( y = ±2x \), based on the values of 'a' and 'b'.
- 🎨 The graph of the hyperbola is sketched with the center at the origin, vertices, transverse axis, and asymptotes.
Q & A
What is the main topic of the video?
-The main topic of the video is to demonstrate how to graph a hyperbola with its center at the origin.
What is the first step in graphing a hyperbola as described in the video?
-The first step is to rewrite the equation of the hyperbola into its standard form by dividing both sides by four and simplifying it to y^2/4 - x^2 = 1.
How does the video determine that the hyperbola opens vertically?
-The video determines that the hyperbola opens vertically because the standard form equation has y^2 in the numerator and x^2 in the denominator.
What is the standard form equation for a hyperbola?
-The standard form equation for a hyperbola is y^2/a^2 - x^2/b^2 = 1 for a vertically opening hyperbola, or x^2/a^2 - y^2/b^2 = 1 for a horizontally opening hyperbola.
What is the value of 'a' in the hyperbola equation provided in the video?
-The value of 'a' is 2, as determined by taking the square root of the denominator in the y^2 term of the standard form equation.
How is the value of 'b' found in the video?
-The value of 'b' is found by recognizing that b^2 is the denominator of the x^2 term in the standard form equation, which is 1, so b equals 1.
What is the value of 'c' in the context of the hyperbola graphing in the video?
-The value of 'c' is the square root of 5, found by using the formula c^2 = a^2 + b^2.
What are the coordinates of the vertices of the hyperbola in the video?
-The vertices of the hyperbola are at (0, 2) and (0, -2), since the hyperbola opens vertically and 'a' is 2.
How long is the transverse axis of the hyperbola described in the video?
-The length of the transverse axis is 4 units, which is 2 times the value of 'a'.
What are the equations of the asymptotes for the hyperbola graphed in the video?
-The equations of the asymptotes are y = 2x and y = -2x, derived from the formula y = ±a/b*x, with 'a' being 2 and 'b' being 1.
How does the video guide viewers to sketch the graph of the hyperbola?
-The video guides viewers to sketch the graph by first plotting the vertices, then drawing the asymptotes, and finally using the asymptotes to outline the hyperbola shape from the vertex.
Outlines
📚 Introduction to Graphing a Hyperbola
The video begins with a brief introduction to the task at hand: graphing a hyperbola with its center at the origin. The presenter outlines the steps required to find the vertices, the length of the transverse axis, and the equations of the asymptotes, emphasizing the importance of rewriting the equation into standard form. The standard form for a hyperbola is given as \( \frac{y^2}{a^2} - \frac{x^2}{b^2} = 1 \), where \( a \) and \( b \) are constants that determine the shape of the hyperbola. The presenter then proceeds to simplify the equation by dividing both sides by four, resulting in \( \frac{y^2}{4} - x^2 = 1 \), which indicates that the hyperbola opens vertically.
📐 Identifying Key Features of the Hyperbola
In this section, the presenter moves on to identify the key features of the hyperbola, such as the vertices and the length of the transverse axis. The vertices are found using the formula \( (0, \pm a) \), leading to the vertices being at (0, 2) and (0, -2). The length of the transverse axis is calculated as \( 2a \), which in this case is 4 units. The presenter also explains how to derive the equations of the asymptotes for a vertically opening hyperbola, which are \( y = \pm \frac{a}{b}x \). Substituting the values of \( a \) and \( b \), the asymptotes are found to be \( y = \pm 2x \).
🎨 Graphing the Hyperbola
The final part of the script focuses on the actual graphing process. The presenter describes how to plot the hyperbola with its center at the origin, starting 2 units upwards from the origin to locate one vertex and 2 units downwards for the other. The transverse axis is marked accordingly. The presenter also explains how to draw the asymptotes, which are lines that the hyperbola approaches but never touches. The video concludes with a reminder to viewers to ask questions or seek clarifications in the comments section and a sign-off from the presenter.
Mindmap
Keywords
💡Hyperbola
💡Vertices
💡Transverse Axis
💡Asymptotes
💡Standard Form
💡Center at the Origin
💡Equation of Hyperbola
💡Conjugate Axis
💡Simplifying Equations
💡Graphing
Highlights
Introduction to graphing a hyperbola with the center at the origin.
Objective to find vertices, length of the transverse axis, and equations of asymptotes.
Rewriting the equation to standard form by dividing both sides by four.
Simplification leads to the standard form of a hyperbola equation.
Identification of the hyperbola opening vertically due to the negative term.
Explanation of the hyperbola formula y^2/a^2 - x^2/b^2 = 1.
Solving for the value of 'a' using the formula.
Determining 'b' value by adding b^2 to the denominator.
Calculating 'c' using the relationship c^2 = a^2 + b^2.
Identifying vertices of the hyperbola using the formula (0, ±a).
Calculating the length of the transverse axis as 2a.
Deriving the equations of the asymptotes for a vertically opening hyperbola.
Graphing the hyperbola by plotting the vertices and transverse axis.
Drawing the asymptotes using the calculated equations.
Final graphing steps to complete the hyperbola sketch.
Conclusion of the video with an invitation for questions and comments.
Sign-off from Prof D with a promise to catch viewers on the flip side.
Transcripts
Browse More Related Video
STANDARD EQUATION OF HYPERBOLA WITH CENTER AT (h, k) || PRE-CALCULUS
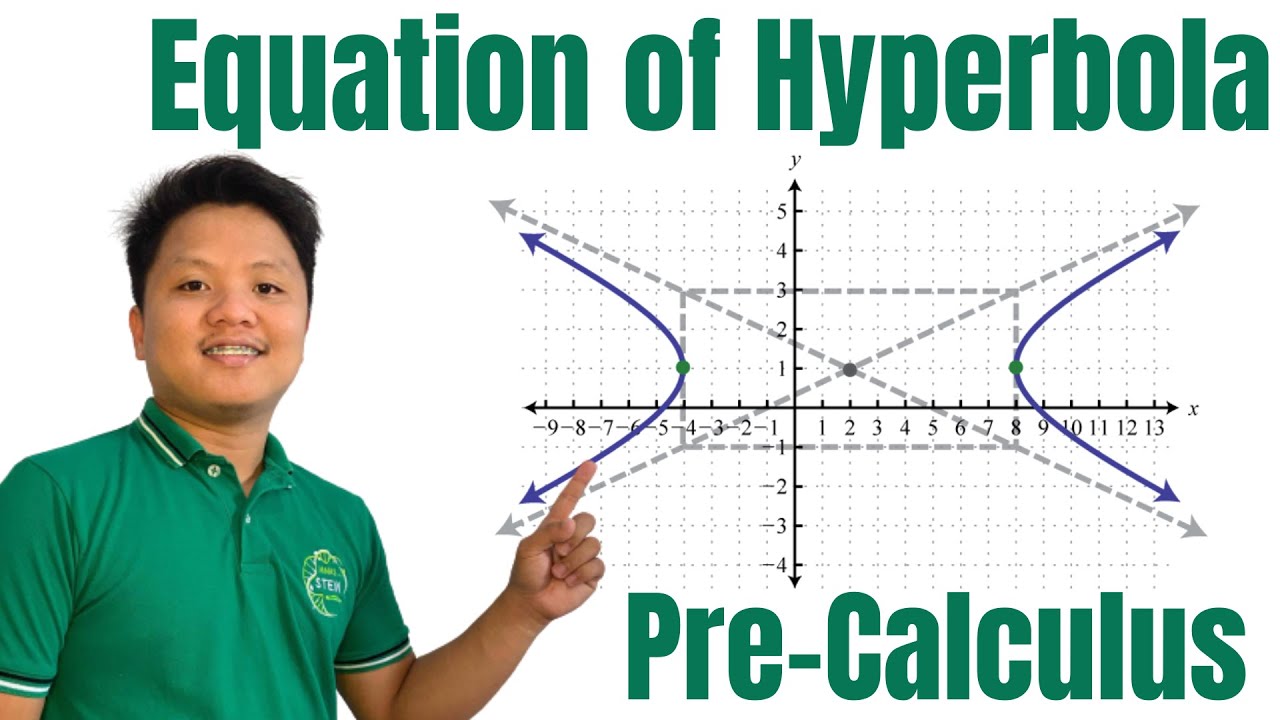
How to find the equation of Hyperbola given its graph
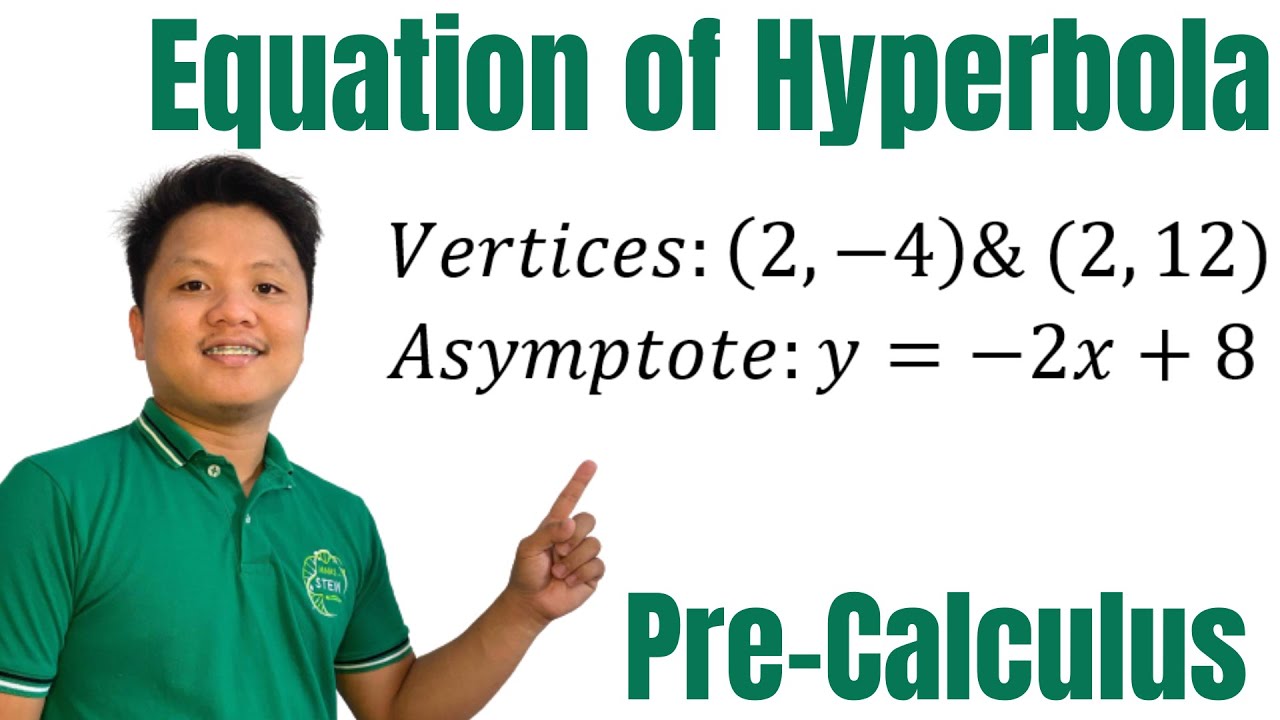
How to find the equation of Hyperbola given vertex, and the equation of asymptote

INTRODUCTION OF HYPERBOLA || PRE-CALCULUS 2
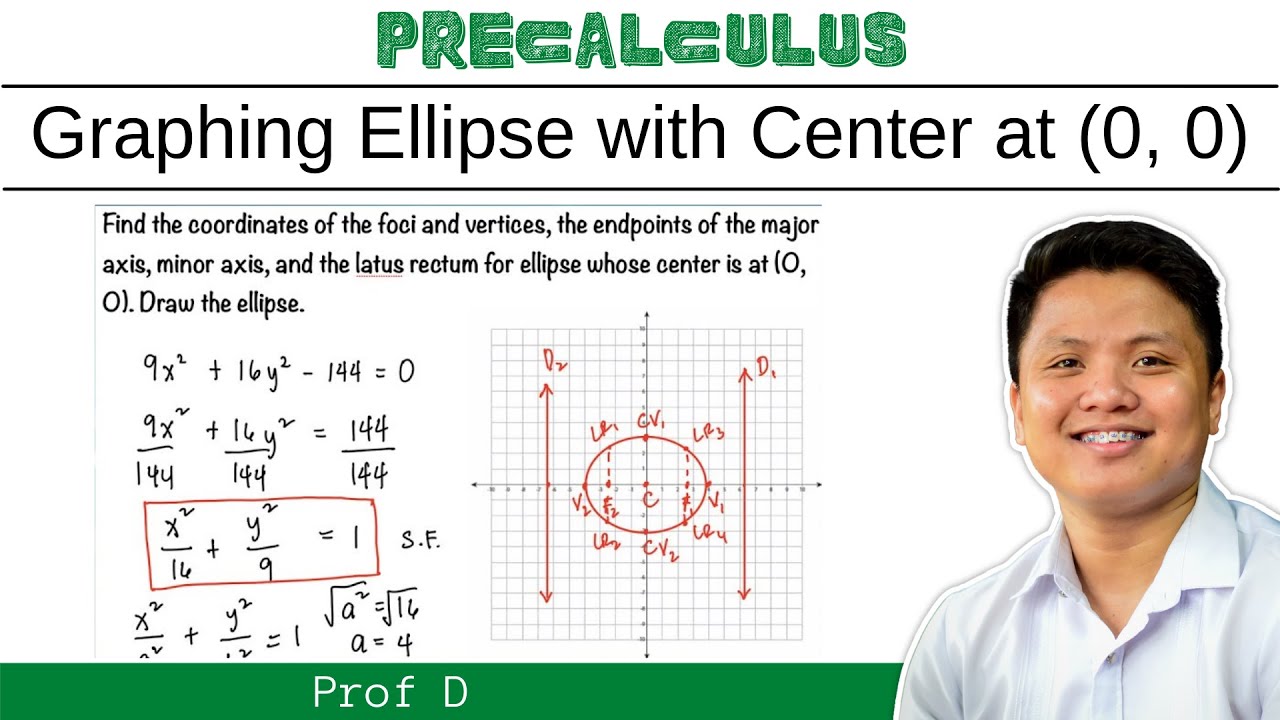
Graphing ellipse with center at the origin | @Prof D
Curve Sketching with Asymptotes x/(x - 2)^2 and Derivatives of Rational Function
5.0 / 5 (0 votes)
Thanks for rating: