BusCalc 14.1 Multivariable Functions
TLDRThe video script is an in-depth exploration of multivariable calculus concepts, focusing on the application of functions involving two independent variables and one dependent variable. The lecturer begins by discussing a hypothetical oil refinery scenario to introduce the topic, using algebra to find the point where local gasoline demand equals production. The script then delves into the evaluation of multivariable functions, using the body mass index (BMI) as an example to demonstrate how to calculate dependent variables from independent variables. The importance of understanding the rate of change in multivariable functions is emphasized through the explanation of partial derivatives. The concept of contour lines is introduced, illustrating how they represent constant elevation on a surface, akin to topographical maps. The script also touches on 3D graphing and the visualization of functions in three-dimensional space, including the use of graphing calculators and the challenges associated with them. Finally, the lecturer discusses the total cost function of an aquarium as a real-world application of multivariable functions, highlighting the cost components based on material prices and dimensions. The summary concludes with a brief mention of the unit circle and sphere equations, and the concept of traces in multivariable functions.
Takeaways
- 📚 The importance of doing a test review was emphasized, as it helps prepare for actual exams.
- 🤔 The script discusses a complex math problem involving an oil refinery's production and local gasoline demand, highlighting the use of algebra to find when demand exceeds production.
- 📉 The use of the quadratic formula to solve for time when local demand equals production was demonstrated.
- 🧮 The concept of integrating supply and demand functions to find the total volume of gasoline exported over a period was explained.
- 📈 The method of polynomial long division was mentioned as a technique to simplify complex functions for easier integration.
- 📊 The script touched on the concept of multivariable functions and how they can be represented in three-dimensional space.
- 📏 The volume of a triangular prism was calculated as an example of a multivariable function, relating to geometry and spatial reasoning.
- 📈 The use of contour lines and topographical maps was explained to visualize changes in elevation or values of a multivariable function.
- 🧮 The Body Mass Index (BMI) was given as an example of a multivariable function, where weight and height are independent variables and BMI is the dependent variable.
- 💰 The total cost of materials for an aquarium was formulated as a multivariable function of its dimensions.
- 🔢 The unit circle and its equation x^2 + y^2 = 1 was derived using the Pythagorean theorem, illustrating the concept of traces along the x and y axes.
Q & A
What is the significance of the year 2009 in the context of the oil refinery mentioned in the transcript?
-The year 2009 is significant because it's the year when the oil refinery starts production. Before 2009, the refinery is not producing any gasoline, diesel, or other products.
What is the formula for local gasoline demand mentioned in the transcript?
-The exact formula for local gasoline demand is not provided in the transcript, but it is described as a function that calculates how much gasoline the locals in an area, such as Joliet, Illinois, are consuming.
How does the transcript describe the process of exporting gasoline?
-The transcript describes exporting gasoline as a process that occurs when the refinery produces more gasoline than the local market can consume. The excess gasoline is then transported, possibly through pipelines to the gulf and shipped to Europe, considering transportation costs.
What is the mathematical approach used to find out when local demand exceeds production for the first time?
-The approach involves setting the local demand equation equal to the production rate equation, then multiplying both sides by (t + 2) to simplify the equation. After rearranging and using algebraic tricks, the resulting quadratic equation is solved using the quadratic formula to find the point in time when demand equals production.
What is the approximate year when local gasoline demand exceeds the production rate for the first time, according to the transcript?
-The year when local gasoline demand first exceeds the production rate is approximately 2015, specifically around September of that year.
How much total gasoline must be exported between the year 2009 and the equilibrium moment in September 2015?
-The total amount of gasoline that must be exported between 2009 and September 2015 is approximately 25.2 million barrels.
What is the method of approximating the total volume of gasoline produced but not consumed by the local market?
-The method involves calculating the definite integral from 2009 (t=9) to the equilibrium point (t=15.8) of the difference between the production function and the demand function, which represents the volume of gasoline produced but not consumed locally.
What is the concept of a multivariable function?
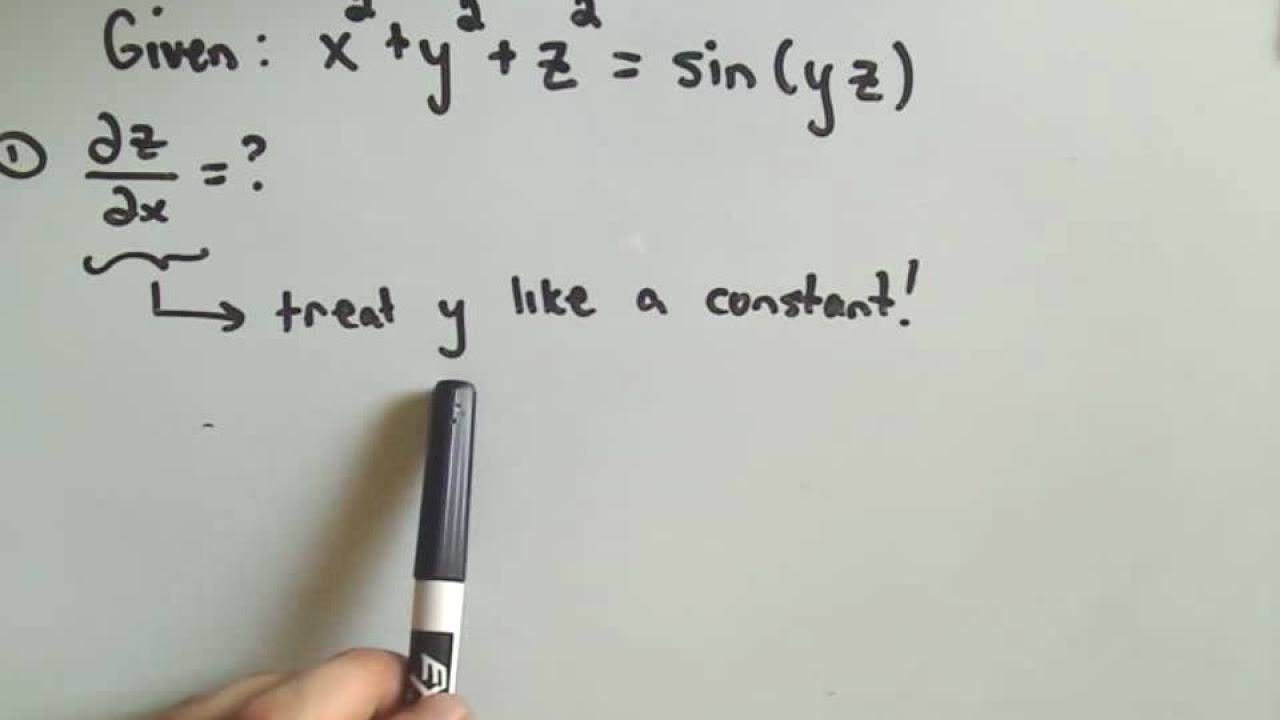
-A multivariable function is a function that depends on more than one input variable. It is represented as z = f(x, y), where z is the dependent variable and x and y are independent variables.
How is the Body Mass Index (BMI) calculated according to the transcript?
-The BMI is calculated using the formula BMI = (703 * weight in pounds) / (height in inches)^2.
What is the significance of the equation x^2 + y^2 = 1 in the context of the transcript?
-The equation x^2 + y^2 = 1 represents the formula for the unit circle, which is a circle with a radius of one centered at the origin in the Cartesian plane.
How does the transcript describe the process of polynomial long division?
-The transcript describes polynomial long division as a method to simplify the process of taking the anti-derivative of a rational function by breaking down the function into a quotient and a remainder, making it easier to integrate.
What is the purpose of contour lines in the context of multivariable functions?
-Contour lines are used to represent the levels of constant z values on the xy-plane. They help visualize the function's behavior and can indicate the direction of steepest ascent or descent on the surface represented by the function.
Outlines
📚 Test Review and Oil Refinery Production Analysis
The paragraph discusses a test review question about an oil refinery's production starting in 2009. It covers the refinery's transition from no production to gasoline production over time, the local demand for gasoline, and the need to export excess production. The instructor also explains the calculation of when local demand will exceed production for the first time using algebraic manipulation and the quadratic formula.
📊 Calculating Exported Gasoline and Multivariable Functions
This section deals with calculating the total amount of gasoline that must be exported between 2009 and an equilibrium point in 2015. It involves integrating supply and demand functions and using polynomial long division to simplify the integrand. The paragraph also touches on multivariable functions, introducing the concept with an example of a function depending on two inputs (x and y) to produce an output (z).
🧮 Special Right Triangles and Multivariable Function Evaluation
The focus is on evaluating multivariable functions, specifically using the example of the volume of a triangular prism. The paragraph explores the properties of special right triangles, such as 30-60-90 triangles, to find the dimensions of the prism's base and consequently its volume. It emphasizes the process of reasoning and verifying through the Pythagorean theorem.
🤔 Body Mass Index (BMI) as a Multivariable Function
The paragraph introduces the concept of BMI as a multivariable function of weight (w) and height (h). It provides a formula for calculating BMI and demonstrates how to compute it for an individual weighing 200 pounds and standing at 5 feet 10 inches. The discussion highlights the need to specify independent variables to determine the dependent variable, BMI.
📈 Visualizing Multivariable Functions with 3D Graphs
This section discusses the representation of multivariable functions in three-dimensional space using graphs. It explains how to plot functions like z = x^2 - y^2 as surfaces and how to interpret them using different visualizing techniques. The paragraph also covers the pros and cons of various graphing calculators and the concept of contour lines representing fixed values of z.
🏞 Contour Lines and Their Applications in Topography
The paragraph explores contour lines in the context of topographical maps, explaining how they represent lines of constant elevation. It discusses the concept of saddle points and how to determine the steepest ascent or descent by analyzing the spacing of contour lines. The discussion also includes examples of different functions and their corresponding contour lines.
🧮 Derivatives, Chain Rule, and Exam Corrections
The final paragraph addresses a question related to derivatives and the chain rule. It clarifies the process of differentiating a natural logarithm function and emphasizes the importance of applying the chain rule correctly. The instructor also mentions posting exam corrections and invites students to ask questions or stay for further clarification.
Mindmap
Keywords
💡Algebra
💡Quadratic Equation
💡Integral Calculus
💡Contour Lines
💡Paraboloid
💡Saddle Point
💡Topographical Map
💡Multivariable Function
💡Derivative
💡Chain Rule
💡Riemann Sum
Highlights
The test review covered a question about an oil refinery's production and local gasoline demand, which was surprising for some students.
The correct method to solve the question involves setting up an equation where local demand equals production and then using algebraic manipulations.
An alternative, appreciated approach by students was using a Riemann sum approximation to estimate the total gasoline produced and consumed.
The moment when local demand first exceeds production is found by evaluating the supply and demand functions at specific points.
The total gasoline exported between 2009 and the equilibrium point is calculated using a definite integral.
Polynomial long division is a useful technique for simplifying expressions, as demonstrated with the function representing gasoline production.
The antiderivative of the integrand is found by applying the rules of integration to the simplified expression.
The process of evaluating the definite integral to find the total exported gasoline is demonstrated step by step.
Contour lines on a topographical map, similar to those used in the function, represent lines of constant elevation.
The concept of a saddle point is introduced, where a function has a minimum in one direction and a maximum in another at the same point.
The BMI formula is used as an example of a multi-variable function, with weight and height as independent variables and BMI as the dependent variable.
Contour lines for different BMI values are calculated based on the BMI formula, showing how weight varies with height for a constant BMI.
The total cost of materials for an aquarium is formulated as a multi-variable function of its dimensions.
The equation of a unit circle is derived using the Pythagorean theorem, showing that x^2 + y^2 = 1 represents a circle with radius one.
The extension of the unit circle equation to three dimensions, x^2 + y^2 + z^2 = 1, is suggested to represent a sphere with radius one.
Traces along the x-axis and y-axis are plotted by setting one variable to zero and observing the function's behavior with respect to the other variable.
The use of derivative chain rule is explained in the context of the derivative of a natural logarithm function.
Transcripts


5.0 / 5 (0 votes)
Thanks for rating: