Calculus BC 2008 2 a | AP Calculus BC | Khan Academy
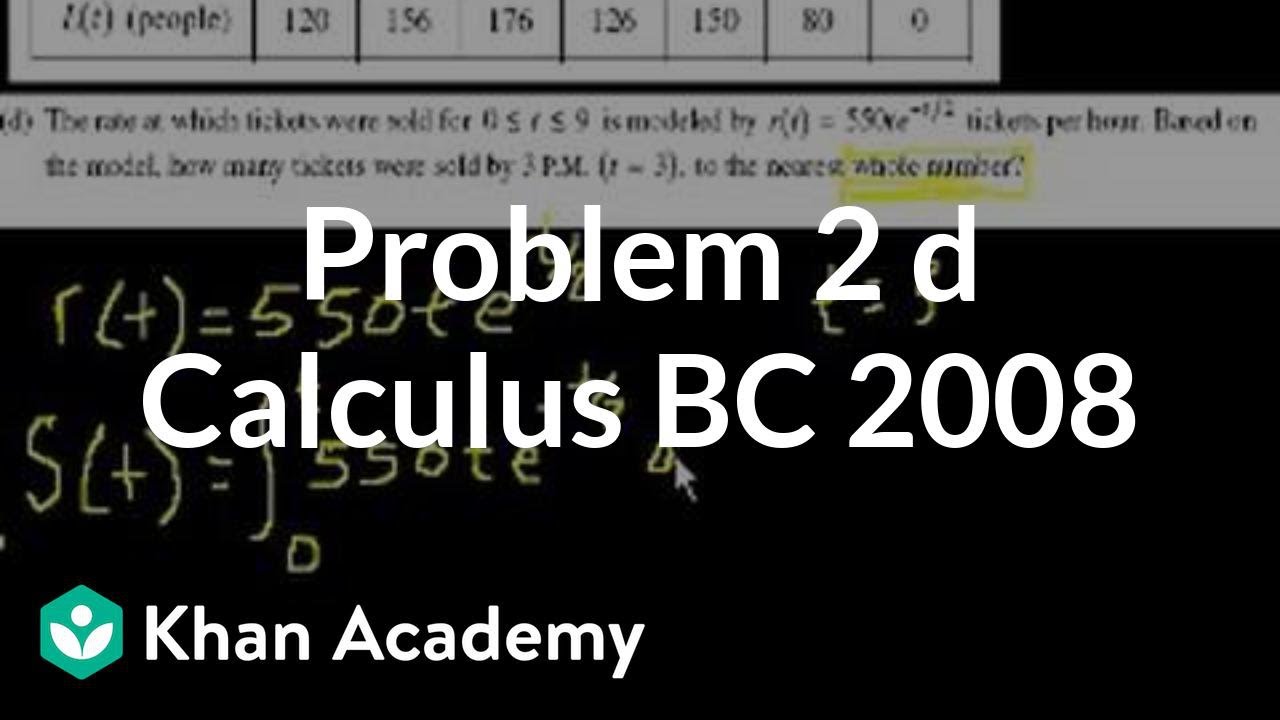
TLDRThe video script discusses problem 2 from the 2008 Calculus BC free-response section, focusing on modeling the number of people waiting in line to purchase concert tickets with a twice differentiable function L(t). The problem involves estimating the rate of change of the number of people in line at 5:30 pm using data points from 4:00 pm and 7:00 pm, and then estimating the average number of people in line during the first 4 hours of ticket sales using a trapezoidal sum with three subintervals. The explanation includes detailed computations and graphing of the function to aid understanding.
Takeaways
- 📈 The problem involves modeling the number of people waiting in line to purchase concert tickets with a twice differentiable function L(t).
- ⏰ The tickets were sold from noon (t=0) and were sold out within 9 hours.
- 📊 Part a of the problem asks to estimate the rate at which the number of people in line was changing at 5:30 pm using the provided data points.
- 🤔 To estimate the rate of change at 5:30 pm, the average rate of change between 4:00 pm and 7:00 pm is calculated.
- 📐 The average rate of change is determined by finding the slope between the data points at t=4 and t=7, which is (L(7) - L(4)) / (7 - 4).
- 📝 The estimated rate of change at 5:30 pm is found to be 9 1/3 people per hour, using the given values of L(7) = 154 and L(4) = 126.
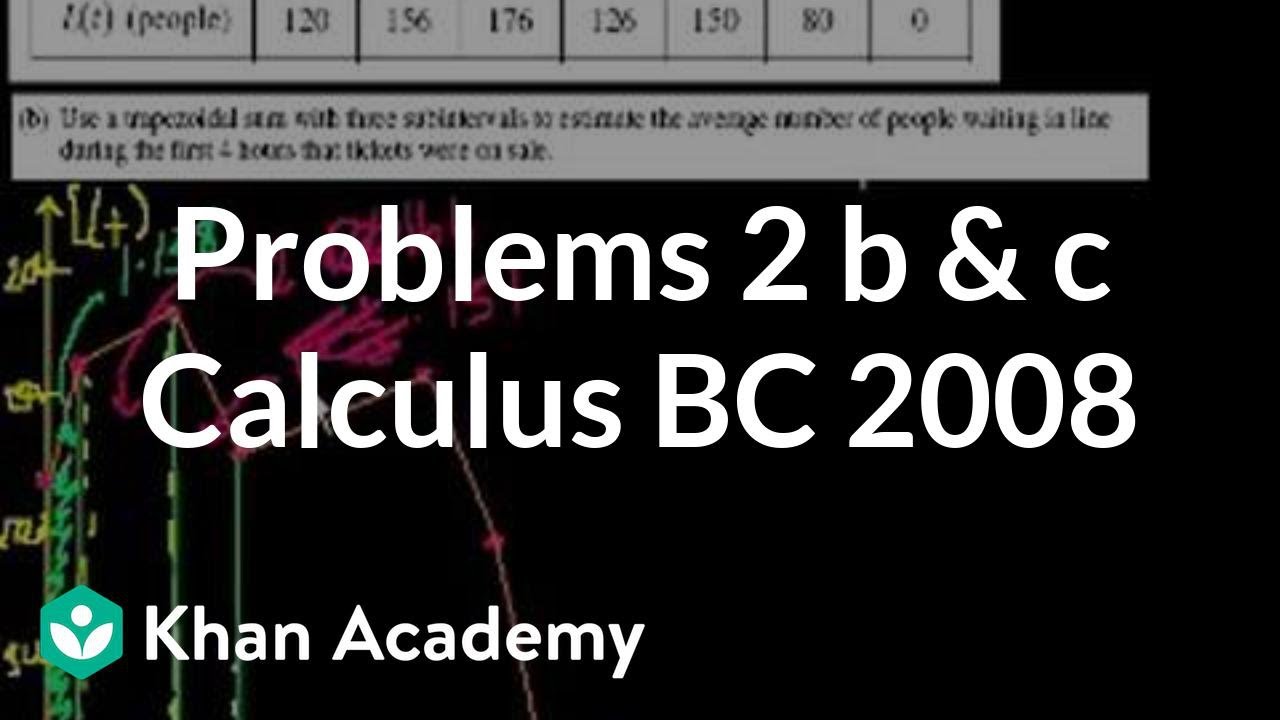
- 🏢 Part b of the problem involves using a trapezoidal sum with three subintervals to estimate the average number of people waiting in line during the first 4 hours.
- 📊 Data points for the first 4 hours are plotted and connected to visualize the trend of people waiting in line.
- 📝 The trapezoidal sum method is an approach to approximate the area under a curve by dividing it into trapezoids and summing their areas.
- 🎯 The video script is a walkthrough for solving a Calculus BC problem, providing a step-by-step explanation and graphical representation of the solution process.
- 🚫 The video script is incomplete, with part b of the problem to be continued in the next video.
Q & A
What is the main topic of the video script?
-The main topic of the video script is solving a Calculus BC problem involving the rate of change of the number of people waiting in line to purchase concert tickets over time.
What is the time frame given for the concert ticket sales?
-The time frame given for the concert ticket sales is from noon (t equals 0) to 9 hours later, when all tickets are sold out.
How is the function L(t) described in the problem?
-The function L(t) is described as a twice differentiable function that models the number of people waiting in line to purchase tickets at any given time t.
What does twice differentiable imply about the function L(t)?
-Twice differentiable implies that the function L(t) is continuous and its derivative is also continuous, existing at all points.
What specific rate of change are we trying to estimate in part a of the problem?
-In part a, we are trying to estimate the rate at which the number of people waiting in line was changing at 5:30 pm.
How is the average rate of change calculated in the script?
-The average rate of change is calculated by finding the slope between two given points on the function, specifically the difference in the function values divided by the difference in the independent variable (time).
What are the given data points for L(t) at 4:00 pm and 7:00 pm?
-The given data points are L(4) = 126 people and L(7) = 154 people.
What is the estimated average rate of change between the times 4:00 pm and 7:00 pm?
-The estimated average rate of change between 4:00 pm and 7:00 pm is 9 1/3 people per hour.
What is part b of the problem asking to estimate?
-Part b is asking to estimate the average number of people waiting in line during the first 4 hours that the tickets were on sale using a trapezoidal sum with three subintervals.
How many data points are there for the function L(t) in the script?
-There are eight data points provided for the function L(t), corresponding to the times 0, 1, 2, 3, 4, 5, 6, 7, and 8 hours.
What is the significance of graphing the data points in part b?
-Graphing the data points in part b helps visualize the function L(t) and its behavior over time, which can aid in understanding how to apply the trapezoidal sum to estimate the average number of people waiting in line.
Outlines
📚 Calculus BC Problem Analysis - Concert Tickets
This paragraph discusses a Calculus BC problem involving the sale of concert tickets. The problem states that tickets went on sale at noon (t=0) and were sold out within 9 hours. The number of people waiting in line to purchase tickets at any given time t is modeled by a twice differentiable function L(t). The main task is to estimate the rate at which the number of people waiting in line was changing at 5:30 pm, using the data provided for 4:00 pm and 7:00 pm. The solution involves calculating the average rate of change between these two points, which is done by finding the slope of the line connecting the given data points. The final estimate is given in units of people per hour, with the best estimate being 9 1/3 people per hour.
📈 Graphical Representation and Trapezoidal Sum
This paragraph continues the discussion on the Calculus BC problem, focusing on the graphical representation of the data points and the use of a trapezoidal sum to estimate the average number of people waiting in line during the first 4 hours of ticket sales. The speaker begins by graphing the data points for the first 4 hours and then extends it to cover the entire 9-hour period for future reference. The graph is used to visualize the function L(t) and its behavior over time. The speaker then explains the concept of a trapezoidal sum and how it can be applied to estimate the average number of people in line during a specified time interval. However, the actual computation of the trapezoidal sum is left for the next video, as the speaker mentions a time constraint.
Mindmap
Keywords
💡Calculus BC
💡Twice Differentiable Function
💡Rate of Change
💡Average Rate of Change
💡Trapezoidal Sum
💡Data Points
💡Graphing
💡Slope
💡Units of Measure
💡Estimation
Highlights
The problem is about modeling the number of people waiting in line to purchase concert tickets using a twice differentiable function L(t).
The tickets were sold out within 9 hours starting from noon, which is t equals 0.
The function L(t) represents the number of people waiting in line at any given time t.
The problem asks to estimate the rate at which the number of people waiting in line was changing at 5:30 pm using data from 4:00 pm and 7:00 pm.
The average rate of change is calculated as the slope between two points, L(7) - L(4), divided by the time difference (7 - 4).
The estimated rate of change at 5:30 pm is found to be 9 1/3 people per hour.
Part b of the problem involves using a trapezoidal sum with three subintervals to estimate the average number of people waiting in line during the first 4 hours of ticket sales.
The trapezoidal sum method is a numerical integration technique used to approximate the area under a curve.
The problem provides data points for the function L(t) at various times throughout the 9-hour period.
The function L(t) is assumed to be continuous and its derivative is also continuous due to twice differentiability.
The problem requires graphing the data points and connecting them to visualize the function L(t).
The graph of L(t) should be a smooth curve since the function is twice differentiable, not having sharp edges.
The average number of people waiting in line during the first 4 hours is to be estimated using the trapezoidal rule.
The problem demonstrates the application of calculus in real-world scenarios, such as modeling ticket sales and customer flow.
The use of the trapezoidal sum in part b illustrates the practical application of numerical methods in approximating integrals.
The problem emphasizes the importance of understanding the rate of change in practical situations, like the rate at which the line is decreasing.
The problem showcases the process of using given data points to estimate unknown values, a common task in mathematical modeling.
The problem is an example of how calculus can be applied to optimize and predict real-life events, such as the timing of when tickets will sell out.
Transcripts


5.0 / 5 (0 votes)
Thanks for rating: