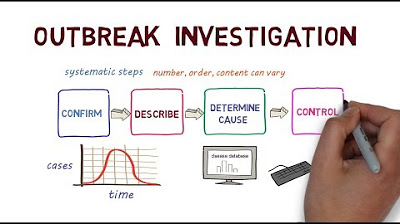
Know how to interpret an epidemic curve?
TLDRThis video delves into the interpretation and creation of epidemiological curves, which visually represent the onset of illness in outbreaks over time. It distinguishes between point source, common source, and propagated outbreaks, explaining the concepts of incubation and infectious periods. The video also explores how these curves can show the progression of disease transmission, eventually leading to the epidemic's decline due to running out of susceptible individuals or public health interventions. The presenter, Greg Martin, also highlights the University of Notre Dame's Master of Science in Global Health program.
Takeaways
- 📈 Epidemiological curves, or 'epi curves', are visual representations of the onset of illness cases in an outbreak over time.
- 🚨 There are three types of outbreaks: point source, common source, and propagated outbreaks, each with distinct characteristics and exposure periods.
- 🕒 The incubation period is the time between exposure to a pathogen and the onset of illness, with a minimum and maximum duration.
- 🌐 In a point source outbreak, people are exposed to a pathogen at a single point in time or over a brief period, like a contaminated food event at a wedding.
- 💧 Common source outbreaks involve continuous exposure to an environmental hazard over time, such as pathogens in a water source.
- 🔄 Propagated outbreaks occur when an infectious agent spreads from person to person, with the index case being the first infected individual.
- 🤒 The latent period is the time between becoming infected and becoming infectious, during which the pathogen is not yet spreading.
- 📊 Epidemiological curves show the distribution of incubation periods and how cases emerge over time, reflecting the dynamics of an outbreak.
- 📉 Epidemics tend to burn out when there are no more susceptible individuals to infect, due to immunity, death, or illness.
- 🛑 Public health measures like education, treatment, and quarantine can control the spread of diseases and prevent outbreaks from becoming endemic.
- 🌐 The University of Notre Dame offers a Master of Science in Global Health program for those interested in studying the science behind global health practice.
Q & A
What is an epidemiological curve?
-An epidemiological curve is a visual representation of the onset of illness of cases in an outbreak over time.
What are the three types of outbreaks discussed in the video?
-The three types of outbreaks discussed are point source outbreaks, common source outbreaks, and propagated outbreaks.
What happens during a point source outbreak?
-In a point source outbreak, a population or group of people are exposed to a pathogen at a single source at a point in time or over a very brief period of time, such as attending the same event and consuming contaminated food.
How does the incubation period relate to an epidemic curve?
-The incubation period is the time between exposure to the pathogen and the onset of illness. The epidemic curve is essentially a distribution of these incubation periods across the affected population.
What is the difference between the minimum and maximum incubation periods?
-The minimum incubation period is the shortest time after which people start getting ill, while the maximum incubation period is the longest time after which no new cases appear, marking the end of the outbreak.
How does a common source outbreak differ from a point source outbreak?
-In a common source outbreak, people are exposed to a pathogen over an extended period of time, such as from a contaminated water source, whereas in a point source outbreak, exposure occurs at a single point in time.
What is a propagated outbreak and how does it spread?
-A propagated outbreak occurs when an infectious agent spreads from person to person. The index case becomes infected, symptomatic, and then infectious, spreading the disease to others during their infectious period.
What is the latent period in the context of a propagated outbreak?
-The latent period is the time between becoming infected and becoming infectious. A person can spread the disease before they show symptoms, which is part of the infectious period.
Why do epidemics eventually burn themselves out?
-Epidemics tend to burn out because the pathogens run out of susceptible people to infect. This can happen due to immunity from recovery, death, ongoing infections, and public health control measures like education, treatment, and quarantine.
What does it mean for a disease to become endemic?
-If a disease does not completely peter out after an outbreak, it may become endemic, meaning there is low-level ongoing transmission within a community.
How can one enhance their understanding of global health and epidemiology?
-One can enhance their understanding of global health and epidemiology by pursuing educational programs like the Master of Science in Global Health program offered by the University of Notre Dame, which provides a solid foundation in the science underpinning global health practice.
Outlines
📊 Introduction to Epidemiological Curves
This paragraph introduces the concept of epidemiological curves, explaining their purpose and how they are used in the context of disease outbreaks. It mentions a two-part video series, with the first part focusing on creating an epidemiological curve using Microsoft Excel. The speaker, Greg Martin, acknowledges the support of the University of NR and briefly touches on the types of outbreaks, including point source, common source, and propagated outbreaks. The explanation emphasizes the importance of understanding the incubation period and how it varies among individuals, leading to the distribution of illness onset times depicted in the epidemic curve.
🔄 Understanding the Spread of Infectious Diseases
The second paragraph delves into the dynamics of infectious disease spread, particularly in propagated outbreaks. It describes the process from the perspective of an individual named John, who contracts the flu and unknowingly spreads it to his coworkers. The explanation covers the latent period, when the virus is not yet contagious, and the infectious period, which begins before symptoms appear. The paragraph illustrates how these concepts are reflected in the epidemic curve, showing how the disease spreads through a population over time, eventually leading to a peak and decline as susceptible hosts become fewer or immune. The paragraph concludes by discussing how outbreaks can burn out due to a lack of susceptible individuals or through public health interventions, and it mentions the possibility of a disease becoming endemic if it does not completely die out.
Mindmap
Keywords
💡Epidemiological Curves
💡Point Source Outbreak
💡Common Source Outbreak
💡Propagated Outbreak
💡Incubation Period
💡Latent Period
💡Infectious Period
💡Minimum and Maximum Incubation Period
💡Public Health Control Measures
💡Endemic
💡Global Health
Highlights
Epidemiological curves are a visual representation of the onset of illness in an outbreak over time.
There are three kinds of outbreaks: point source, common source, and propagated outbreaks.
In a point source outbreak, people are exposed to a pathogen at a single source at a point in time or over a brief period.
A common source outbreak involves exposure to an environmental hazard over a period of time, such as pathogens in a water source.
Propagated outbreaks occur when an infectious agent spreads from person to person.
The incubation period is the time between exposure to a pathogen and becoming ill.
The minimum and maximum incubation periods define the range during which no one gets ill after exposure.
Epidemic curves show the distribution of incubation periods in a population.
In a common source outbreak, people continue to get sick until the end of the maximum incubation period from the end of exposure.
Person-to-person spread in a propagated outbreak involves an index case becoming symptomatic after an incubation period.
The infectious period is when a person can pass on the disease, which may start before they become symptomatic (latent period).
The epidemic curve shows how the disease spreads through a population, with spikes in cases corresponding to the incubation periods of individuals.
Epidemics tend to burn out when there are no more susceptible people to infect, due to immunity, death, or ongoing infection.
Public health control measures like education, treatment, and quarantine can help prevent the spread of disease.
If an epidemic does not burn out completely, it may become endemic, meaning there is low-level ongoing transmission within a community.
Interpreting epidemic curves helps understand the dynamics of disease spread and the effectiveness of control measures.
The video is part of a two-part series on epidemiological curves, with the first part focusing on how to make them using Microsoft Excel.
The University of Notre Dame offers a Masters of Science in Global Health program for those interested in studying the science behind global health practice.
Transcripts


5.0 / 5 (0 votes)
Thanks for rating: