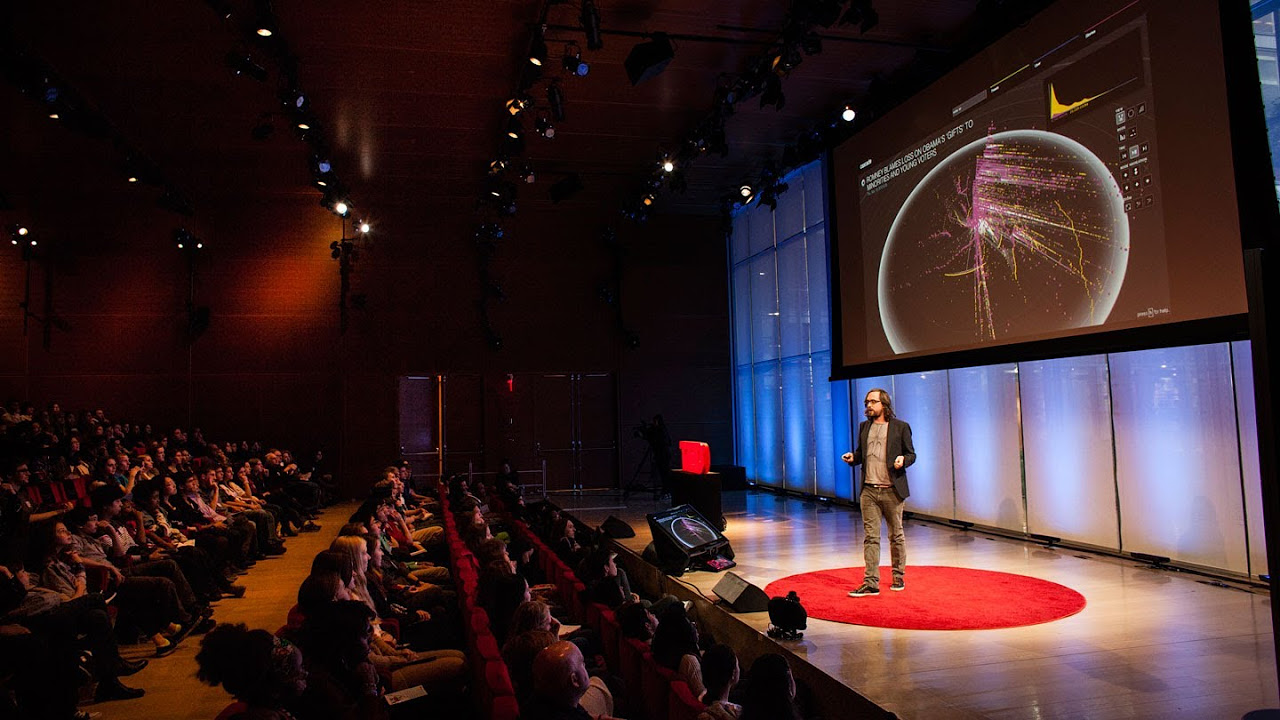
TEDxVancouver - Jer Thorp - The Weight of Data
TLDRThe speaker shares his journey from being influenced by Apple's creativity to becoming a data artist at the New York Times. He highlights the importance of understanding systems through visual tools, such as his work on the 9/11 memorial and the Open Paths project, emphasizing the need to view data in a human context to build empathy and respect for privacy.
Takeaways
- 🌟 The speaker's early fascination with computers and Apple's influence led to a career in creative computing.
- 📚 The importance of history is discussed as the stitching together of past events into a narrative.
- 💡 Bill Atkinson's HyperCard program is highlighted for empowering users to create their own applications.
- 🎨 The speaker's journey from HyperCard to using data in art projects reflects a blend of technology and creativity.
- 🌐 The use of data in art projects, such as comparing word usage in the New York Times, demonstrates the power of visualization.
- 🚀 The speaker's work at the New York Times as a data artist-in-residence involves exploring data in new ways.
- 🔗 The 'Cascade' tool developed with Mark Hanson illustrates how content is shared on the internet and the connections between people.
- 🏙️ The 9/11 memorial project in Manhattan, where the speaker contributed, shows the value of storytelling through data.
- 📱 The 'Open Paths' project encourages users to share their iPhone location data for research, highlighting the personal stories within data.
- 🌍 The speaker advocates for considering data within a human context to foster empathy and a better understanding of privacy.
- 🎭 The call for artists, poets, and writers to participate in data discussions emphasizes the need for a human element in technology.
Q & A
What is the main theme of the talk?
-The main theme of the talk is the intersection of data, history, and technology, particularly focusing on how historical events and personal stories can be represented and understood through data visualization and digital tools.
How did the speaker's early experiences with computers influence their career?
-The speaker's early experiences with computers, specifically getting a computer at the age of 12 and being exposed to HyperCard, sparked their interest in technology and creativity. This led them to a career that combines art, science, and design, using data visualization to understand and represent complex systems.
What is HyperCard and why is it significant?
-HyperCard was a program developed by Bill Atkinson that came preloaded on Mac computers. It allowed users to create their own applications, which was revolutionary at the time. The speaker considers HyperCard significant because it was the last program to ship on a public computer that was designed for users to make programs, inspiring a generation of creators and thinkers.
How does the speaker use data in their artwork?
-The speaker uses data to create visual representations of complex systems and narratives. They build graphics that compare word usage in the New York Times, simulate economies, and track the movement of people on social media. These artworks are meant to provide insights into how systems work and to aesthetically represent data.
What was the purpose of the 'Cascade' tool developed by the speaker and Mark Hanson?
-The 'Cascade' tool was developed to explore how content is shared on the internet from person to person over time. It visualizes the sharing structures that underlie the internet, allowing users to see the threads of conversation and the spread of content across networks.
How did the speaker contribute to the 9/11 memorial in Manhattan?
-The speaker worked with a company called Local Projects to develop an algorithm and software tool that helped the architects of the 9/11 memorial layout the names in a way that reflects the relationships between the people who were killed. The tool allowed the architects to generate a layout that satisfied adjacency requests and make adjustments to tell the stories of the victims.
What is 'Open Paths' and how does it work?
-Open Paths is a system developed by the speaker's team that allows users to upload their iPhone location data and broker relationships with researchers to share that data. It provides an interface for users to visualize their lives unfolding from the traces left behind on their devices, offering a personal and moving experience by putting data into a human context.
What is the speaker's call to action regarding data?
-The speaker encourages people to start thinking about data in a human context to gain a better understanding of the information we're sharing and to build empathy for the people involved in these systems. They also call for the inclusion of artists, poets, and writers in the dialogue about data to bring a human element into the discussion.
How does the speaker suggest that data visualization can change our understanding of technology and privacy?
-The speaker suggests that by putting data into a human context through visualization, we can automatically build empathy and a fundamental respect for the individuals involved. This can lead to a different dialogue about issues like privacy, recognizing that numbers are not just abstract but are tethered to real-world experiences and carry weight.
What is the significance of the speaker's personal stories in relation to the talk's theme?
-The speaker's personal stories, such as their experience moving to New York and working on the 9/11 memorial, serve to illustrate the theme of the talk by showing how historical events and personal narratives can be understood and represented through data. These stories highlight the transformative power of data when it is connected to human experiences.
How does the speaker's background in art and design influence their approach to data?
-The speaker's background in art and design influences their approach to data by focusing on the aesthetic representation of information and the creation of visual tools that help them understand complex systems. This approach combines scientific analysis with creative expression, resulting in data visualizations that are both informative and visually engaging.
Outlines
📚 The Intersection of Data, History, and Creativity
The speaker begins by highlighting the significance of data and history, positioning them as two of the most exciting fields. He shares his personal story, emphasizing the transformative impact of Apple's technology on his life and creative pursuits. The narrative focuses on the influence of Bill Atkinson and HyperCard, a program that allowed users to create their own applications, which played a pivotal role in the speaker's journey into the world of data and visual storytelling.
🌐 Visualizing Data and Social Networks
This paragraph delves into the speaker's fascination with visualizing data and social networks. He discusses his projects, such as mapping Twitter users' travel patterns and analyzing global greetings, to understand human behavior and movement. The speaker's work with the Kepler project and his role as a data artist-in-residence at the New York Times are highlighted, showcasing his innovative approach to data visualization and storytelling.
🏙️ The 9/11 Memorial: A Tangible Narrative of Connections
The speaker shares his involvement in the 9/11 memorial project, emphasizing the importance of representing the relationships between the victims through the layout of their names. He describes the process of working with Local Projects to develop an algorithm and software tool that helped architects fulfill the memorial's design vision, which was to honor the connections that existed in the lives of those lost. The speaker reflects on the power of narrative and how it transforms a static memorial into a living testament to the interconnectedness of human lives.
📱 Humanizing Data: Empathy and Privacy
In the final paragraph, the speaker discusses the concept of 'Open Paths,' a system that allows individuals to share their iPhone location data for research purposes. He reflects on the emotional impact of visualizing personal data, such as the trajectory of his life in New York, and argues for the importance of humanizing data to foster empathy and a deeper understanding of privacy issues. The speaker calls for a broader dialogue that includes artists and creative thinkers to enrich the conversation around data, emphasizing the transformative potential of data when infused with human context.
Mindmap
Keywords
💡History
💡Data
💡HyperCard
💡Creativity
💡Cascade
💡Social Networks
💡Data Visualization
💡Human Context
💡Privacy
💡Empathy
Highlights
The speaker discusses the intersection of data and history, emphasizing the importance of storytelling in historical documentation.
Personal anecdotes are shared to illustrate the transformative power of technology, particularly the rapid acquisition of a computer at a young age.
The influence of Apple's rainbow logo is mentioned, highlighting the cultural impact of the company on the speaker and others in the tech industry.
Bill Atkinson and his creation, HyperCard, are credited for enabling users to create their own programs, which was a revolutionary concept at the time.
HyperCard's role in the speaker's life is emphasized, showing its influence on their career path and the development of their artistic and data-driven projects.
The speaker's transition from creating art with computers to working with data is detailed, showcasing the evolution of their career and interests.
The concept of 'timepiece graphs' is introduced, which visually represents data over time in a unique and aesthetically pleasing manner.
The use of data in the creation of the 9/11 memorial is discussed, illustrating the practical application of data in commemorating human connections.
The speaker's role as a data artist-in-residence at the New York Times is mentioned, highlighting their work on various projects involving data visualization.
The 'Cascade' tool is introduced, which visualizes the spread of content on the internet, providing insights into how information travels between individuals.
The importance of context in data is emphasized, arguing that understanding the human element behind data can lead to a more empathetic and respectful approach to technology and privacy.
The 'Open Paths' project is described, which allows users to share their iPhone location data with researchers, demonstrating the potential of crowd-sourced data.
The emotional impact of viewing personal data in the context of one's life is discussed, showing how data can tell a story about our experiences.
A call to action is made for a more human-centric approach to data, suggesting that artists, poets, and writers should be included in discussions about data to enrich the conversation.
The potential of data to transform society is highlighted, with the speaker advocating for a more inclusive and empathetic approach to the growing field of big data.
The speaker's personal journey from being influenced by HyperCard to working on significant projects like the 9/11 memorial and data visualization at the New York Times illustrates the power of technology to shape our understanding of the world.
Transcripts
Browse More Related Video
Visualizing the world's Twitter data - Jer Thorp
One of the Greatest Speeches Ever | Steve Jobs

How I'd Learn Data Analytics in 2024 (If I Had to Start Over)
The Man That Makes Millionaires: How To Turn $1,000 Into $100 Million!: Alex Hormozi | E235
Your Dark Side and Control Over Your Life | Robert Greene | EP 237

NLM Science, Technology, and Society Lecture - Confronting Race, Gender, & Ability Bias in Tech
5.0 / 5 (0 votes)
Thanks for rating: