2610 Chapter 1-4 Review
TLDRThis video script is a comprehensive review of statistical concepts from the first four chapters of a statistics course. It covers key ideas such as sampling, bias, probability, and distributions, with an emphasis on understanding representative samples, types of bias, and the importance of good statistical procedures. The instructor provides strategies for note-taking and encourages students to engage with the material by asking questions. The session also includes a discussion on experimental design and the difference between association and causation, aiming to prepare students for exams and real-world applications.
Takeaways
- 📚 The video is a review session covering the first four chapters of a statistics course, focusing on key concepts and review problems.
- 🔍 The instructor emphasizes the importance of understanding sampling and its goal to be representative of the entire population, despite inherent challenges in ensuring this.
- 📝 It's recommended to start studying by brainstorming and writing down key concepts, such as different types of sampling like simple random sampling (SRS), cluster sampling, systematic sampling, and stratified sampling.
- 🔢 The instructor explains the difference between parameters (like population mean, represented by Greek letter mu) and statistics (like sample mean, represented by x-bar).
- ⚖️ The concept of bias in sampling is discussed, including types like oversampling bias, response bias, and sampling error, which is the difference between the sample statistic and the population parameter.
- 🧐 The session touches on the difference between quantitative and qualitative data, and the importance of understanding the context of designed experiments to prove causation.
- 📈 Key graphs and charts used in statistics are mentioned, such as box plots, histograms, stem-and-leaf plots, and frequency polygons for time series data.
- 📊 The instructor discusses the shapes of distributions, including uniform, modal, skewed, and symmetric, and how these can be represented graphically.
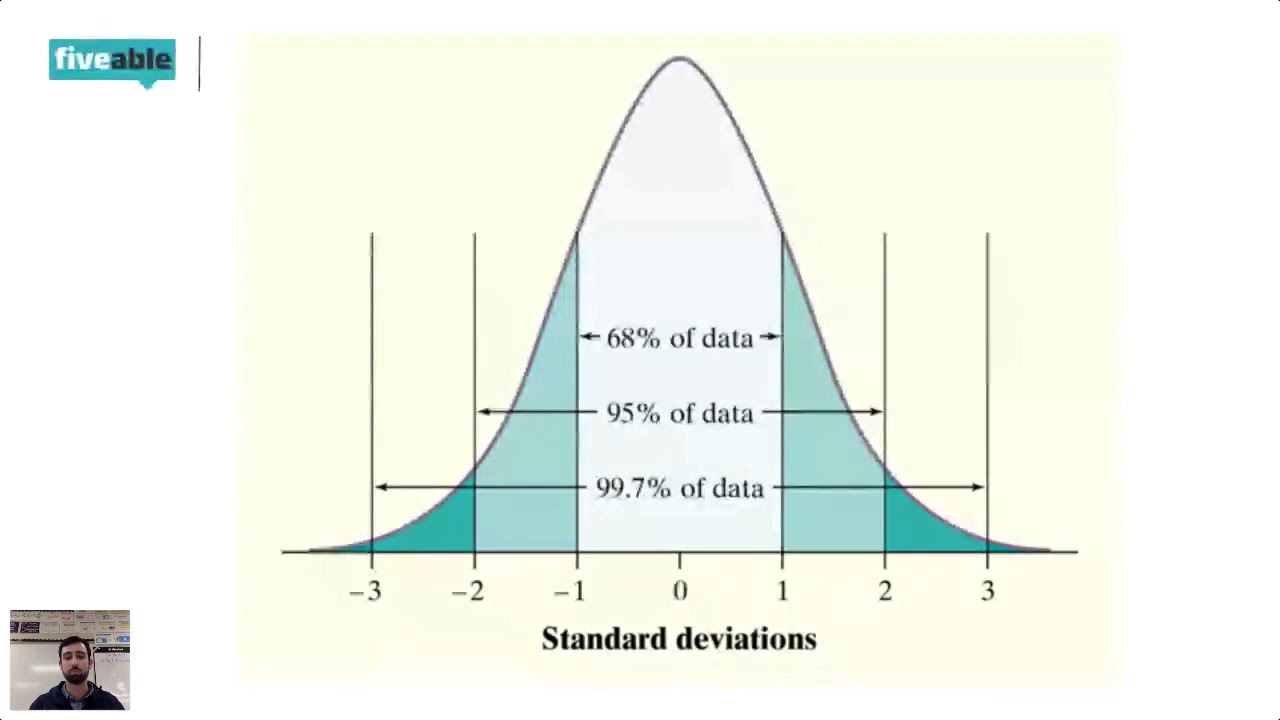
- 📚 The empirical rule and the concept of a normal (bell-shaped) curve are introduced, explaining how data is distributed around the mean with respect to standard deviations.
- 🎯 The grading on a curve is clarified, explaining that it involves a fixed percentage of students receiving each grade, which is often misunderstood.
- 🤔 The video script ends with a discussion on probability, including the basics of sample space, outcomes, events, and the formulas for calculating probabilities of unions and intersections of events.
Q & A
What is the main purpose of sampling in statistical studies?
-The main purpose of sampling is to obtain a representative subset of a larger population that can be used to make inferences about the whole population.
What does 'representative' mean in the context of sampling?
-A sample is considered representative if it accurately reflects the characteristics of the entire population it is drawn from.
Why is it difficult to determine if a sample is truly representative of a population?
-It is difficult because you cannot examine the entire population to compare it with the sample, and you must assume that your sampling procedure was good and that the sample is representative.
What are the four main types of sampling methods discussed in the script?
-The four main types of sampling methods discussed are cluster sampling, simple random sampling, systematic sampling, and stratified sampling.
What is the difference between a population parameter and a sample statistic?
-A population parameter is a characteristic measured for the entire population, such as the population mean (mu), while a sample statistic is an estimate of that parameter based on a sample, such as the sample mean (x̄).
What is the empirical rule and how does it apply to a normal distribution?
-The empirical rule states that for a normal distribution, about 68% of the data falls within one standard deviation of the mean, 95% within two standard deviations, and 99.7% within three standard deviations.
What is meant by 'grading on a curve' and how does it differ from a linear adjustment of grades?
-Grading on a curve means assigning letter grades based on the distribution of scores, with a fixed percentage of students receiving each grade. A linear adjustment, however, involves changing the grading scale to fit the distribution of scores, which is not the same as grading on a strict curve.
What is the difference between a designed experiment and an observational study in terms of causation?
-A designed experiment aims to establish causation by using randomization, replication, and control, while an observational study can only show association and cannot prove causation due to the lack of these elements.
What is a placebo effect and how is it related to designed experiments?
-The placebo effect is a phenomenon where participants in an experiment experience a perceived improvement simply because they believe they are receiving treatment. It is related to designed experiments as it is a factor to be controlled for by using placebos in the experimental design.
What are the three components of a well-designed experiment according to the script?
-The three components of a well-designed experiment are randomization, replication, and control.
Can you explain the concept of 'standard deviation' in the context of the script?
-Standard deviation is a measure of the amount of variation or dispersion in a set of values. In the script, it is used to understand how spread out individual scores are from the mean score in a distribution.
How does the script define 'bias' in the context of sampling?
-Bias in sampling refers to systematic errors introduced into the sampling process that cause the sample to be unrepresentative of the population. Examples include oversampling bias, undersampling bias, response bias, and wording biases.
What are the different types of biases mentioned in the script and how do they affect sampling?
-The script mentions several types of biases including oversampling bias, undersampling bias, response bias, and wording biases. These biases can skew the results of a sample, making it unrepresentative of the true population, and thus affect the accuracy of the conclusions drawn from the sample.
Outlines
📚 Review of Statistical Concepts
The speaker begins by discussing the structure of the video, which is a review of the first four chapters of a statistics course. They emphasize that the session is recorded for later review and that it's more important to understand and ask questions rather than taking exhaustive notes. Key concepts from chapter one are brainstormed, focusing on the importance of representative sampling. The speaker explains that a representative sample should accurately reflect the population, though it's challenging to verify this without examining the entire population. Different sampling methods such as simple random sampling, cluster sampling, systematic sampling, and stratified sampling are briefly introduced, with an emphasis on the ideal of simple random sampling. Parameters and statistics, such as population mean (mu), variance (sigma squared), and standard deviation (sigma), are defined, and the distinction between them is clarified.
🔍 Understanding Bias and Error in Sampling
This paragraph delves into the topic of sampling bias, which occurs when the sampling process introduces inaccuracies into the results. Various types of biases are mentioned, including oversampling and undersampling bias, response bias, and wording biases. The speaker also explains the concept of sampling error, which is the natural discrepancy between a sample statistic and the true population parameter. It's highlighted that increasing the sample size can reduce this error. The discussion then moves to quantitative versus qualitative data, and the components of well-designed experiments, including randomization, replication, control, and treatments. The placebo effect and blinding are also touched upon as important elements in experimental design.
🧐 Exploring Paired Experiments and Biases
The speaker discusses the concept of paired experiments, where the same subjects are exposed to different conditions to control for variables. Examples include using identical twins or married couples as paired subjects. The paragraph also revisits the topic of biases in sampling and experiments, emphasizing the importance of recognizing and accounting for them. The goal of designed experiments is to establish causation, and the speaker stresses that without proper randomization, replication, and control, one can only observe association, not causation.
📊 Analyzing Different Types of Graphs
This section covers various types of quantitative graphs, such as box plots, histograms, stem-and-leaf plots, and frequency polygons. The speaker explains how these graphs can represent data distributions and how to interpret their shapes, including uniform, modal, and skewed distributions. Qualitative graphs like pie charts, bar charts, and Pareto charts are also mentioned. The paragraph concludes with a discussion on the importance of understanding the shape of data distribution, including the concepts of variance, standard deviation, and outliers, and how they can be represented and calculated using graphs like the box plot.
📉 The Impact of Grading on a Bell-Curve
The speaker discusses the concept of grading on a curve, explaining that it involves a distribution of grades with a specific percentage of students receiving each grade. They clarify misconceptions about the practice, stating that true curve grading is rare and often misunderstood. The paragraph also touches on the empirical rule and the normal distribution, explaining how data points are distributed around the mean within one, two, and three standard deviations. The speaker uses IQ scores as an example of a bell-shaped distribution and discusses the implications of scores that fall outside the typical range.
🎯 Fundamentals of Probability
This paragraph introduces the basics of probability, including the concepts of experimental and theoretical probabilities, the sample space, outcomes, events, and mutually exclusive events. The speaker explains the difference between the probability of an intersection and the probability of a union of events, as well as the concept of independent events. They also discuss the formulas used to calculate these probabilities and the importance of understanding the sample space and the events within it.
🤔 Applying Probability to Real-World Scenarios
The speaker provides an example of applying probability to a scenario involving the approval rating of same-sex marriage among California registered voters. They explain how to calculate the probability of approval given support for same-sex marriage and vice versa. The paragraph also discusses the importance of understanding the relative position of a score in relation to the mean and standard deviation, emphasizing that a score's significance is determined by how many standard deviations it is from the mean, not just the raw score itself.
Mindmap
Keywords
💡Representative Sampling
💡Sampling Bias
💡Parameters and Statistics
💡Quantitative vs. Qualitative Data
💡Designed Experiments
💡Blinding
💡Causation vs. Association
💡Probability
💡Mutually Exclusive Events
💡Standard Deviation
💡Normal Distribution
💡Grading on a Curve
💡Relative Position
Highlights
Introduction to the review of the first four chapters with a focus on key concepts and review problems.
Explanation of the importance of note-taking and asking questions during the learning process.
Discussion on the concept of sampling and the ideal of a representative sample.
Different types of sampling methods, including simple random, cluster, systematic, and stratified sampling.
The distinction between population parameters and sample statistics, such as mean (μ), variance (σ^2), and standard deviation (σ).
Clarification of the terms 'population proportion' and 'sample proportion' using symbols p and p̂.
Introduction to the concept of sampling bias and its various types, such as oversampling and response bias.
The normalcy of sampling error and methods to decrease it, such as increasing sample size.
Differentiation between quantitative and qualitative data and their respective types of graphs.
Explanation of designed experiments and their components: randomization, replication, and control.
Importance of understanding the difference between causation and association in experiments.
Discussion on the bell curve, empirical rule, and the concept of outliers in a normal distribution.
Misunderstandings about grading on a curve and the correct statistical interpretation.
Basics of probability, including the concepts of sample space, outcomes, events, and mutually exclusive events.
Explanation of independent events and how to prove their independence using probability formulas.
Introduction to different probability distributions such as binomial, geometric, and hypergeometric.
The process of identifying the population, sample, parameter, statistic, variable, and data in various scenarios.
Calculating probabilities and understanding the concepts of union and intersection of events.
The concept of relative positioning of scores based on their distance from the mean in terms of standard deviations.
Transcripts
Browse More Related Video
2022 Live Review 2 | AP Statistics | Making Sense of Probability & Random Variables
AP Statistics 10-Minute Recap
2021 Live Review 7 | AP Statistics | Taming the Investigative Task on the AP Statistics Exam

Is AP Statistics Right For You? An Overview of AP Statistics (in 10 minutes)
AP Stats - Cram Review (2019)

Elementary Statistics Chapter 1
5.0 / 5 (0 votes)
Thanks for rating: