Rectilinear Motion or Particle Motion or Straight Line Motion!
TLDRThe video script discusses rectilinear motion, also known as particle motion or straight-line motion, focusing on a particle moving along the x-axis. The position of the particle at time T is given by a specific equation involving t-2 and t-6. The video aims to answer several questions, including creating a representation of the motion, determining when the particle moves to the right, when it changes direction, and whether its speed increases or decreases at T=4.5. The farthest left position from the origin that the particle reaches is also explored. The analysis involves finding the velocity and acceleration functions, identifying turning points, and using a sign chart to determine the direction of motion and speed changes. The video provides a detailed walkthrough of these calculations and their implications on the particle's motion, adapted from a 1972 AP exam question.
Takeaways
- 📐 The video discusses rectilinear motion, also known as particle motion or straight-line motion, which is the movement along the x-axis.
- 🚀 The position of the particle at any time T is given by the equation X(T) = (t - 2)^3 * (t - 6).
- ⏰ The velocity function V(T) is derived from the position function and is used to determine the turning points of the motion.
- 🔍 Potential turning points are found by setting V(T) to zero, which gives T = 5 and T = 2, although T = 2 is not an actual turning point.
- 📊 A table of values is created for T and X(T) at the endpoints and critical points to visualize the motion.
- 📈 The direction of the particle's movement is determined by the sign of the velocity function, with the particle moving to the right when T > 5.
- 🔄 The particle changes direction at T = 5, as indicated by a sign change in the velocity function from negative to positive.
- ↗️ At T = 4.5, the particle's speed is decreasing because the velocity and acceleration have opposite signs.
- 📉 The acceleration function A(T) is derived from the velocity function, and its sign is used to determine if the speed is increasing or decreasing.
- 🏁 According to the candidate's theorem, the farthest left of the origin the particle moves is found at an endpoint or critical point within the interval of interest.
- 🔢 The farthest left position on the interval from 0 to 6 is at T = 5, where X = -27, indicating the minimum position before the particle moves to the right indefinitely.
Q & A
What is rectilinear motion?
-Rectilinear motion, also known as particle motion or straight-line motion, refers to the movement of an object along a straight path, typically along a specified axis such as the x-axis.
How is the position of a particle in rectilinear motion described?
-The position of a particle in rectilinear motion at any given time 'T' is described by a function X(T), which represents the particle's displacement along the axis of motion at time 'T'.
What is the significance of finding the velocity function V(T)?
-The velocity function V(T), which is the first derivative of the position function X(T), is crucial for determining the speed and direction of the particle's motion at different points in time. It helps identify when the particle is moving to the right or left and when it changes direction.
How do you determine when the particle changes direction?
-The particle changes direction at points where its velocity V(T) equals zero. These points are potential turning points. By analyzing the sign change of the velocity function around these points, one can determine if and when the particle actually changes direction.
What does it mean if velocity and acceleration have opposite signs?
-If the velocity (V(T)) and acceleration (a(T)) of a particle have opposite signs at a particular time 'T', it indicates that the particle's speed is decreasing at that instant.
How can you find out if the particle's speed is increasing or decreasing at a specific time?
-To determine if the particle's speed is increasing or decreasing at a specific time 'T', one can evaluate the signs of the velocity and acceleration at that time. If they have the same sign, the speed is increasing; if they have opposite signs, the speed is decreasing.
What is the role of the acceleration function a(T)?
-The acceleration function a(T), which is the second derivative of the position function X(T), provides information about the rate of change of velocity. It helps in understanding how the speed of the particle is changing over time.
How can you represent the motion of a particle graphically?
-The motion of a particle can be represented graphically by plotting the position function X(T) against time 'T' on a graph. This allows for a visual representation of the particle's path, direction of motion, and turning points.
What is the significance of the farthest left point from the origin that the particle reaches?
-The farthest left point from the origin that the particle reaches is significant as it represents the minimum value of the position function X(T) within a given interval. This point indicates the maximum distance the particle has traveled to the left of the origin.
How can you find the farthest left point from the origin that the particle reaches?
-To find the farthest left point from the origin, one can evaluate the position function X(T) at the endpoints of the interval of interest and at any critical points where the velocity V(T) equals zero. The point with the most negative value of X(T) will be the farthest left point.
What is the Candidates' Theorem, and how does it apply to this problem?
-The Candidates' Theorem (also known as the Extreme Value Theorem) states that if a function is continuous on a closed interval, it attains both an absolute maximum and minimum on that interval. In the context of this problem, it is used to assert that the farthest left point of the particle's motion will occur at an endpoint or at a critical point within the interval of motion.
Why is it important to create a table of values for the position function X(T) at critical points and endpoints?
-Creating a table of values for the position function X(T) at critical points and endpoints helps in understanding the behavior of the particle's motion. It provides specific data points that can be used to plot the motion, identify turning points, and determine the farthest left point from the origin.
Outlines
📐 Rectilinear Motion Analysis
This paragraph introduces the concept of rectilinear motion, also known as particle motion or straight-line motion. The video aims to address various questions regarding the motion of a particle moving along the x-axis, with its position at time T given by a specific function. The motion representation includes determining when the particle moves to the right, changes direction, and its speed variation at T equals 4.5. It also seeks to find the farthest left position of the particle from the origin. The problem is adapted from the 1972 AP exam, and viewers are encouraged to access the original questions through the website M OMS org, with a suggested donation.
📈 Velocity and Direction Changes
The second paragraph delves into the velocity of the particle, which is derived from the position function. By applying the product rule and chain rule, the velocity function is obtained, and potential turning points are identified by setting the velocity equal to zero. A table of values is created to visualize the motion, and a graph is plotted to represent the particle's trajectory. The direction of the particle's movement is determined by analyzing the sign of the velocity function, leading to the conclusion that the particle moves to the right when T is greater than five.
📉 Speed and Acceleration at a Specific Time
The third paragraph focuses on the particle's speed and acceleration at T equals 4.5. The velocity and acceleration functions are used to create a sign chart, which helps determine the direction of the particle's movement and whether its speed is increasing or decreasing. By substituting T equals 4.5 into the velocity and acceleration functions, it is concluded that the particle's speed is decreasing at this specific time because the velocity and acceleration have opposite signs.
🔍 Identifying the Farthest Left Position
The final paragraph addresses the question of the farthest left position of the particle from the origin. Utilizing the Candidates' test for continuous functions, the absolute minimum value of the position function is sought. The endpoints and critical points of the motion are identified, and by evaluating the position function at these points, it is determined that the farthest left position occurs at T equals 5, where the position X equals negative 27. This analysis assumes the particle's motion is confined to the interval from 0 to 6.
Mindmap
Keywords
💡Rectilinear motion
💡Position function
💡Velocity
💡Acceleration
💡Turning points
💡Sign chart
💡Candidates' theorem
💡Direction of motion
💡Speed
💡Graphical representation
💡Endpoint
Highlights
The video discusses rectilinear motion, also known as particle motion or straight-line motion.
A particle's motion is described along the x-axis with its position at time T given by a specific equation involving t.
The velocity function V of T is derived from the position function using the product rule and chain rule.
Potential turning points in the motion are identified where the velocity V of T equals zero, at T equals 5 and T equals 2.
A table of values for T and X of T is created to visualize the particle's motion.
The particle's direction of motion is determined by analyzing the sign of the velocity function.
The particle is found to be moving to the right when T is greater than five, as indicated by the velocity sign chart.
The change in the particle's direction is determined at T equals 5, where there is a sign change in the velocity function.
The particle's speed at T equals 4.5 is analyzed using both velocity and acceleration calculations.
The particle's speed is determined to be decreasing at T equals 4.5 due to the opposite signs of velocity and acceleration.
The farthest left position from the origin that the particle reaches is calculated using the candidate's theorem.
The endpoints and critical points of the particle's motion are used to find the farthest left position.
The video concludes that the farthest left position is at T equals 5, where X equals negative 27.
The video provides a comprehensive analysis of rectilinear motion, including direction, speed, and extreme positions.
The problem discussed is adapted from the 1972 AP exam, showcasing the timelessness of the concepts taught.
The video emphasizes the importance of understanding the relationship between position, velocity, and acceleration in motion analysis.
The use of a sign chart is demonstrated as a method to determine the intervals of motion direction and speed change.
The video concludes with practical advice on how to approach similar problems, emphasizing the need for clear and justified work.
Transcripts
Browse More Related Video
2004 AP Calculus AB Free Response #3

2017 AP Calculus AB Free Response #5
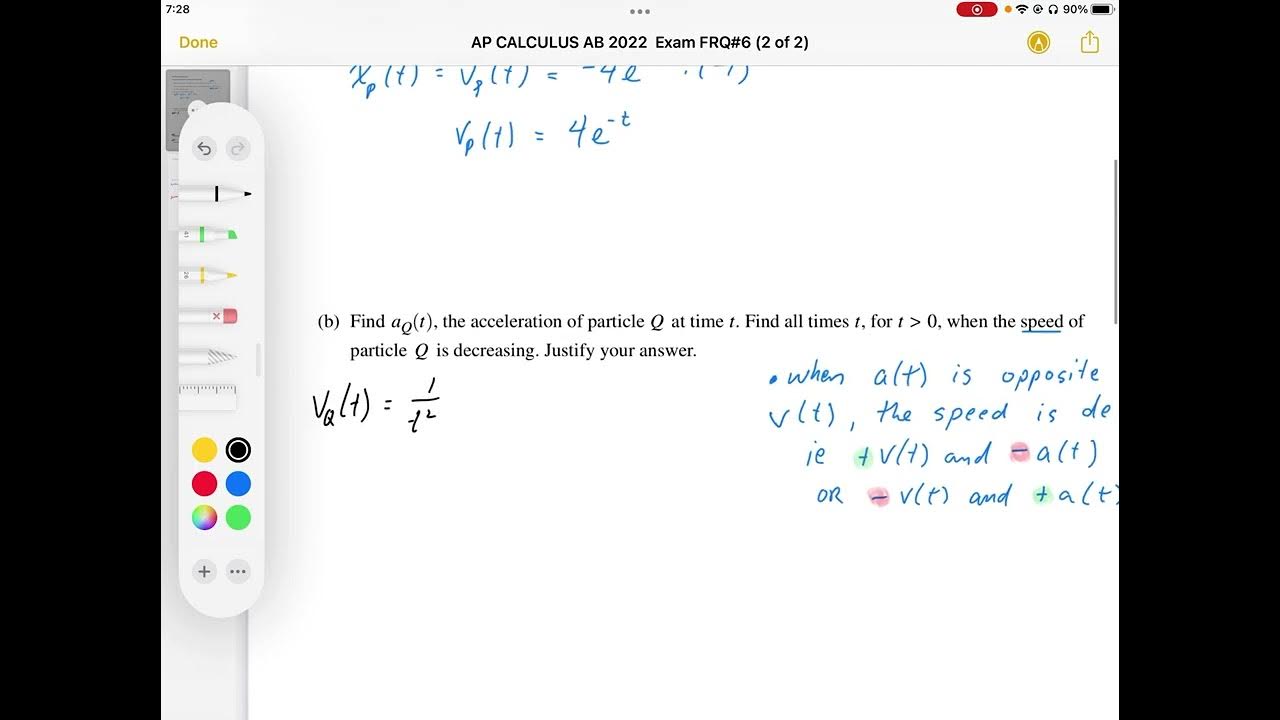
AP CALCULUS AB 2022 Exam Full Solution FRQ#6(a,b)
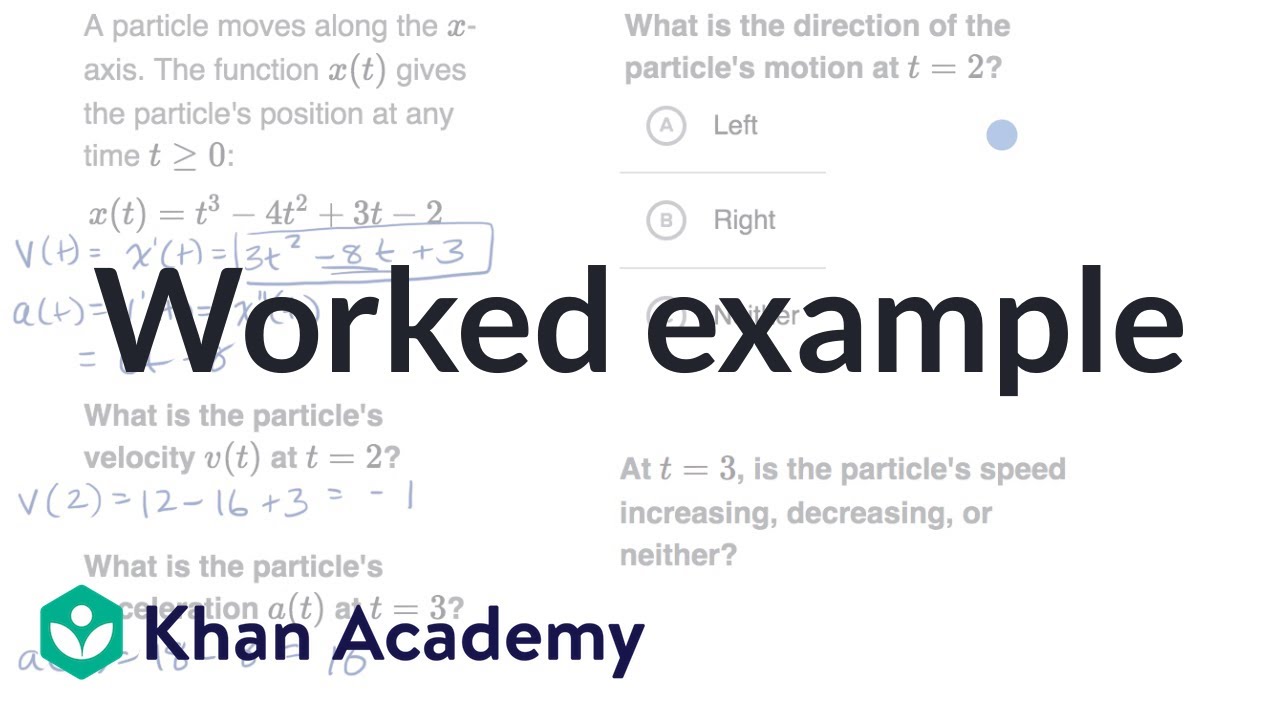
Worked example: Motion problems with derivatives | AP Calculus AB | Khan Academy

2011 AP Calculus AB Free Response #1
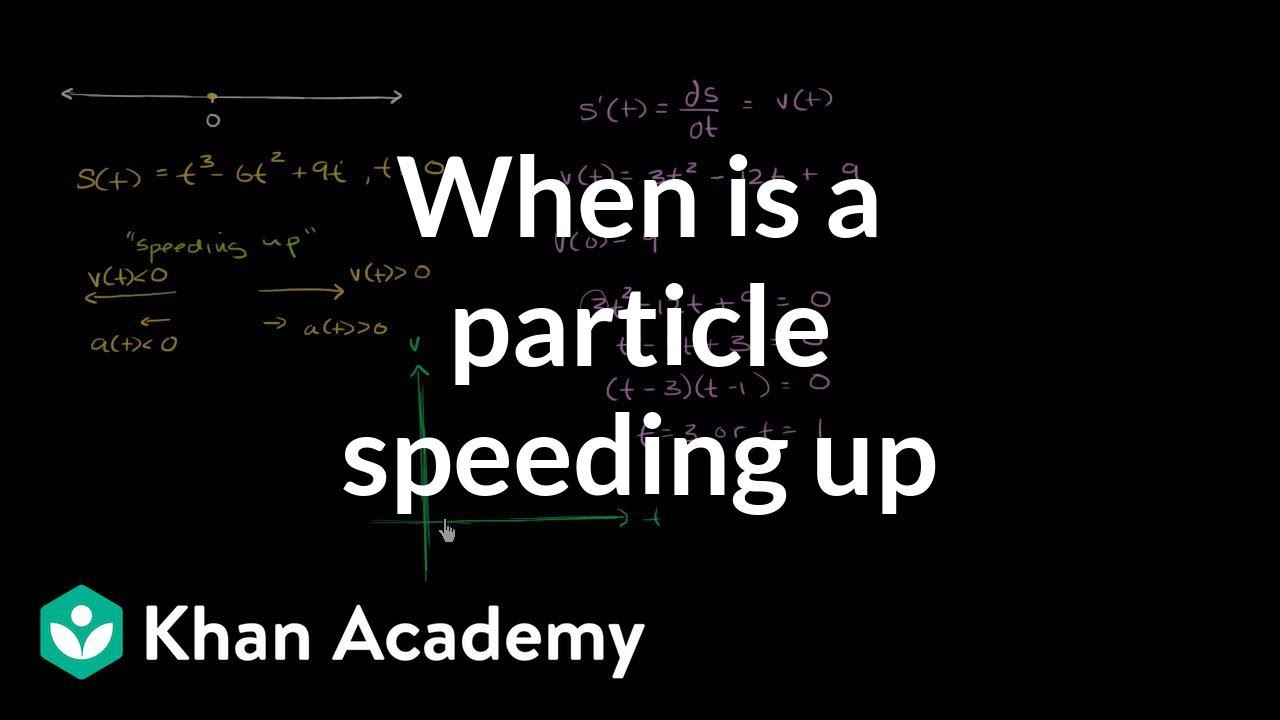
Motion problems: when a particle is speeding up | AP Calculus AB | Khan Academy
5.0 / 5 (0 votes)
Thanks for rating: