Acid Base Titration Curves
TLDRThis script explains the concept of a titration curve, detailing the process of titrating a strong acid with a strong base, a strong acid with a weak base, and a weak acid with a strong base. It describes the shape of the curve, the equivalence point, and the pH changes throughout the titration. The script also discusses the role of spectator ions and the formation of buffers, particularly at the equivalence point of a weak acid with a strong base titration, where the pH equals the pKa due to the presence of a conjugate acid-base pair.
Takeaways
- 📈 A titration curve is a graphical representation of the volume of titrant added to an analyte versus pH changes.
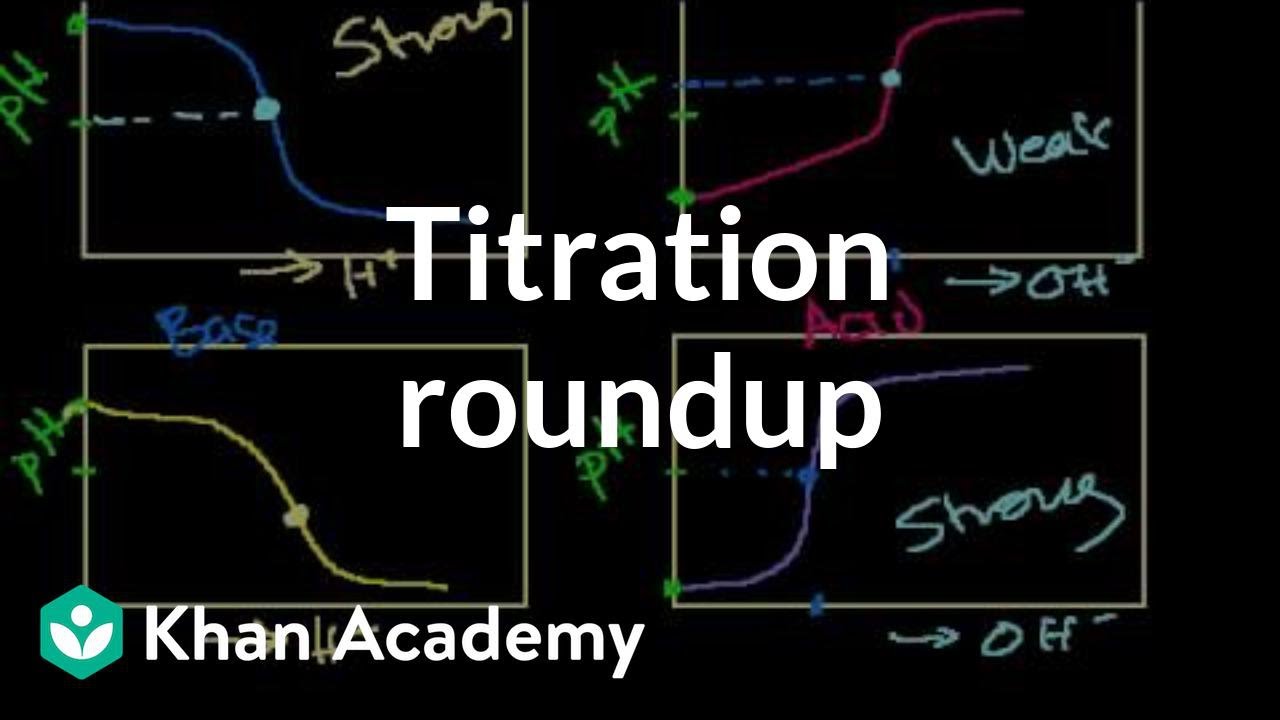
- 🧪 The shape of a titration curve for a strong acid with a strong base shows a low initial pH, a significant pH increase, and an equivalence point around pH 7.
- 🔄 At the equivalence point, the moles of the strong acid equal the moles of the strong base, resulting in a neutral pH of 7.
- 🏷️ Strong acid and strong base titration has a clear, sudden pH change at the equivalence point, indicating complete neutralization.
- 🌟 When a strong acid is titrated with a weak base, the equivalence point is below pH 7, indicating a slightly acidic solution due to the weak base's partial ionization.
- 🌀 In the case of a weak base, its conjugate acid is stronger, which slightly acidifies the solution at the equivalence point.
- 🧪 For a weak acid and a strong base titration, the initial pH is higher than with a strong acid, and the equivalence point is above pH 7, indicating a slightly basic solution.
- 🔄 The weak acid partially dissociates, making its conjugate base stronger and causing the pH at the equivalence point to be higher than 7.
- 📊 The titration curve for a weak acid with a strong base shows a buffer region where the pH remains relatively stable due to the conjugate acid-base pair.
- 🌟 At the midpoint of the buffer region, the pH equals the pKa, which is derived from the understanding Hasselbalch equation.
- 🏷️ The buffer region demonstrates the ability of a weak acid and its conjugate base to resist changes in pH when a strong base is added.
Q & A
What is a titration curve?
-A titration curve is a graphical representation that plots the volume of titrant added to an analyte against the pH change during the titration process.
What is the significance of the initial pH in a titration curve?
-The initial pH indicates the acidity or basicity of the solution before titration begins. A very low pH signifies a strong acid, while a high pH indicates a strong base.
What happens at the equivalence point in a titration?
-At the equivalence point, the moles of the acid equal the moles of the base added. This is where the solution is ideally neutralized, with a pH of around 7 for a strong acid-strong base titration.
Why is the pH at the equivalence point not exactly 7 in a strong acid-weak base titration?
-In a strong acid-weak base titration, the pH at the equivalence point is not exactly 7 because the weak base does not completely dissociate, leaving some of the acid unreacted and resulting in a slightly acidic solution.
What are spectator ions in the context of titration?
-Spectator ions are ions that do not participate in the neutralization reaction during titration. For example, in the titration of HCl with NaOH, Na+ and Cl- are spectator ions as they do not chemically react or change.
How does a weak base differ from a strong base in a titration curve?
-A weak base partially dissociates in solution, resulting in a less dramatic change in pH compared to a strong base, which fully dissociates. This leads to a less steep rise in pH during the titration and a higher equivalence point pH than 7.
What is a buffer region in a titration curve?
-The buffer region is an area on the titration curve where the pH changes slowly due to the presence of a conjugate acid-base pair. This region is characterized by the pH being equal to the pKa of the weak acid being titrated.
How does the pH change during a weak acid-strong base titration?
-In a weak acid-strong base titration, the pH starts higher than in a strong acid-strong base titration because the weak acid is less acidic. The pH rises gradually and the equivalence point is above 7, indicating a slightly basic solution.
What is the relationship between pH and pKa in the buffer region?
-In the buffer region, the pH is equal to the pKa of the weak acid. This is because the concentrations of the conjugate base and the conjugate acid are equal, resulting in a pH that reflects the acid dissociation constant (Ka).
What is the significance of the buffer region's pH being equal to the pKa?
-When the pH is equal to the pKa, the concentrations of the conjugate acid and the conjugate base are equal, indicating a state of equilibrium. This is significant because it shows the point at which the weak acid and its conjugate base are present in equal amounts, contributing to the buffering capacity.
How does the titration of a weak acid with a strong base create a buffer?
-The titration of a weak acid with a strong base creates a buffer by generating a conjugate acid-base pair. The strong base donates hydroxide ions (OH-) to neutralize the H+ ions from the weak acid, forming the conjugate base. This process establishes a dynamic equilibrium between the weak acid and its conjugate base, which resists changes in pH.
Outlines
📈 Understanding Titration Curves: Strong Acid with Strong Base
This paragraph explains the concept of a titration curve, specifically for a strong acid being titrated with a strong base. The curve is a plot of the volume of titrant (strong base) added versus the pH change of the solution. The initial pH is very low, indicating a strong acid, and as the titrant is added, the pH rises sharply to a high value, indicating a strong base. The equivalence point, where the moles of acid equal the moles of base, is in the middle of this pH change and is around pH 7, indicating a neutral solution. The explanation also touches on the stoichiometry of the reaction, with H+ ions from the strong acid combining with OH- ions from the strong base to form water (H2O). The paragraph references a previous video for further understanding of the titration process.
📊 Titration Curves: Strong Acid with Weak Base vs. Weak Acid with Strong Base
This paragraph delves into the differences in titration curves when a strong acid is titrated with a weak base, and when a weak acid is titrated with a strong base. For the strong acid with weak base scenario, the equivalence point is slightly acidic, with a pH a bit below 7, due to the partial ionization of the weak base (NH3) in water. Conversely, for the weak acid with strong base titration, the pH at the equivalence point is a bit higher than 7, as the weak acid (e.g., acetic acid) partially dissociates, resulting in a stronger conjugate base (acetate) that can accept protons and shift the pH higher. The paragraph also introduces the concept of a buffer region, where the pH remains relatively stable due to the presence of a conjugate acid-base pair, and the pH at the midpoint of the titration equals the pKa of the weak acid.
Mindmap
Keywords
💡Titration Curve
💡Titrant
💡Analyte
💡pH
💡Equivalence Point
💡Strong Acid
💡Strong Base
💡Weak Base
💡Weak Acid
💡Conjugate Acid-Base Pair
💡Buffer Region
Highlights
A titration curve is a plot of the volume of titrant added to the analyte versus pH.
The general shape of a titration curve for a strong acid titrated with a strong base shows a significant pH change.
At the equivalence point of a strong acid-strong base titration, the pH is around 7, indicating a neutral solution.
The presence of spectator ions (Na+ and Cl-) does not affect the chemical outcome of a titration.
In a strong acid-weak base titration, the equivalence point has a pH slightly below 7, resulting in a slightly acidic solution.
Weak bases like ammonia (NH3) partially dissociate in water, leading to a pH lower than 7 at the equivalence point.
The conjugate acid of a weak base (e.g., NH4+ from NH3) is slightly stronger than the parent base, influencing the pH.
Titration curves for weak acids and strong bases show a pH higher than 7 at the equivalence point due to the weak acid's nature.
Weak acids like acetic acid (CH3COOH) partially dissociate, making their conjugate bases stronger and affecting the pH at the equivalence point.
The buffer region during a weak acid-strong base titration is characterized by a pH equal to the pKa of the weak acid.
The buffer region is formed due to the presence of a conjugate acid-base pair, such as acetic acid and acetate.
The pH at the equivalence point in a buffer region is determined by the concentration of the conjugate base and its corresponding acid.
The concept of the equivalence point is crucial in titration as it indicates the stoichiometric equivalence of the acid and base.
Understanding titration curves is essential for accurate determination of the concentration of an unknown solution.
The shape of a titration curve can reveal the strength of the acid or base being titrated.
Titration is a valuable analytical tool used in chemistry for determining the concentrations of solutions and understanding acid-base reactions.
The equivalence point's pH can deviate from 7 depending on the strength of the acid or base involved in the titration.
The study of titration curves helps in understanding the stoichiometry and the dynamics of acid-base neutralization reactions.
Transcripts
Browse More Related Video

17.2 Acid-Base Titrations and Titration Curves | General Chemistry

Titration curves and acid-base indicators | Chemistry | Khan Academy

Weak Acid / Strong Base Titration - All pH Calculations

Acid Base Titration Curves - pH Calculations

Titration curves and indicators
Titration roundup | Buffers, titrations, and solubility equilibria | Chemistry | Khan Academy
5.0 / 5 (0 votes)
Thanks for rating: