Wave Period and Frequency
TLDRIn this informative video, Mr. Andersen explains the concepts of wave period and frequency, emphasizing their inverse relationship. He uses flashing lights to illustrate the period as the time between oscillations and frequency as the number of oscillations per second, measured in hertz. The video further demonstrates how to calculate these values from wave diagrams, using a phet simulation to visually represent the concepts and mathematical formulas to convert between period and frequency. The lesson aims to help viewers understand how to determine period and frequency from graphical representations and equations.
Takeaways
- 📏 Period is the time between oscillations in a wave, measured in seconds.
- 🔊 Frequency is the number of oscillations or waves per unit time, measured in hertz (Hz).
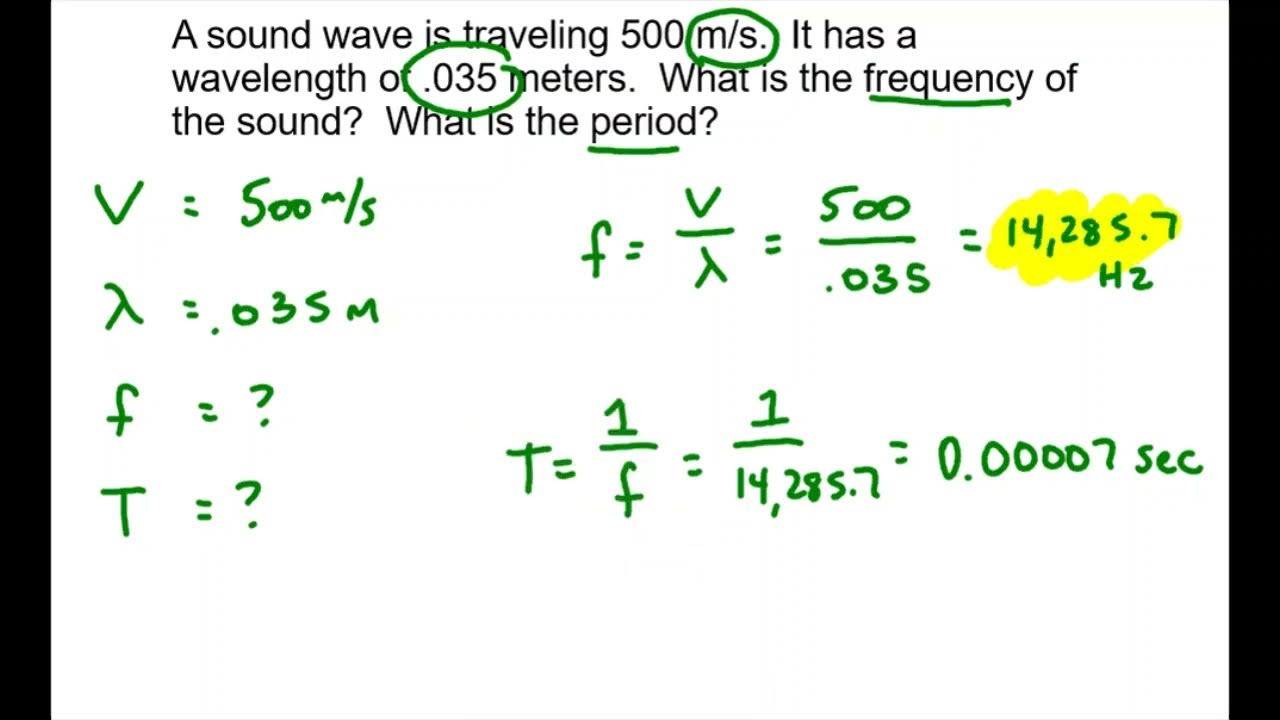
- 🔄 The relationship between period (T) and frequency (f) is reciprocal; f = 1/T and T = 1/f.
- 💡 Understanding the period and frequency involves observing flashing lights or waves and determining the time intervals.
- 🌟 Flashing lights can be used to demonstrate the concept of period, with the example of a light flashing every 1 second having a period of 1 second.
- 🌐 The frequency of a slower flashing light, with 1 flash every 2 seconds, is 0.5 Hz.
- 🌊 Waves transfer energy through oscillations, with period being the time between waves and frequency being the number of waves per unit time.
- 📊 When analyzing a wave diagram, identify the axes labels to determine period and frequency from the position vs. time graph.
- 🧠 To find the period from a graph, measure the distance between one wave to the next, and for frequency, calculate the reciprocal.
- 🧪 A simulation can visually demonstrate the calculation of period and frequency, such as observing the time for one oscillation and counting the number of waves in a given time.
- 📝 In a problem-solving scenario, use the provided axes on a graph to calculate the period by finding one wavelength and then determine the frequency using the formula f = 1/T.
Q & A
What is the definition of wave period?
-The wave period is the time between oscillations in a wave.
How is frequency defined in the context of waves?
-Frequency refers to the number of oscillations or waves that occur per unit time.
What is the relationship between wave period and frequency?
-Wave period and frequency are reciprocals of each other.
How can you determine the period of a flashing light as shown in the video?
-You determine the period by measuring the time between each flash. In the video, it was 1 second.
What unit is used to measure frequency?
-Frequency is measured in hertz (Hz).
How can you calculate the frequency from the period?
-To calculate the frequency from the period, you take the reciprocal of the period (1 divided by the period).
What is the significance of waves transferring energy through oscillations?
-Waves transfer energy from one point to another through their oscillations, which is a key aspect of wave behavior and interaction with matter.
How do you interpret a wave diagram with position on the x-axis and time on the y-axis?
-To interpret such a wave diagram, you measure the distance between waves (wavelength) to find the period, and the reciprocal of that gives you the frequency.
What was the period calculated in the simulation during the video?
-The period calculated in the simulation was 0.67 seconds.
How can you convert a given period into frequency mathematically?
-You can convert a given period into frequency by taking the reciprocal of the period (1 divided by the period in seconds).
In the video, how was the frequency determined from the two wave peaks 25 seconds and 45 seconds apart?
-The frequency was determined by taking the reciprocal of the period, which was the difference between the two wave peaks (45 seconds - 25 seconds = 20 seconds), resulting in a frequency of 0.05 hertz.
What was the main teaching point of the video?
-The main teaching point of the video was to understand the concepts of wave period and frequency, their relationship, and how to calculate them using both real-life examples and graphical representations.
Outlines
📚 Introduction to Wave Period and Frequency
This paragraph introduces the concepts of wave period and frequency. Mr. Andersen explains that period is the time between oscillations in a wave, while frequency is the number of oscillations or waves per unit time. He clarifies the difference between frequency and wave velocity, and uses flashing lights as an analogy to illustrate the concepts. The period of the first light is 1 second, resulting in a frequency of 1 hertz, while the second light has a period of 2 seconds, leading to a frequency of 0.5 hertz. The relationship between period and frequency is established as reciprocal, and the transfer of energy through oscillations in waves is briefly discussed.
Mindmap
Keywords
💡Wave Period
💡Frequency
💡Oscillations
💡Reciprocal
💡Energy Transfer
💡Wave Diagram
💡PhET Simulation
💡Position vs. Time Graph
💡Hertz
💡Velocity
💡Mathematical Conversion
Highlights
The concept of wave period and frequency is introduced, emphasizing their importance in understanding wave behavior.
Period is defined as the time between oscillations in a wave, and frequency is the number of oscillations per unit time.
The video clarifies the common confusion between frequency and wave velocity, focusing on the distinct concepts of period and frequency.
An example using flashing lights illustrates how to determine the period by observing the time between flashes.
The period of the first light is established as 1 second, with a corresponding frequency of 1 hertz.
The second light has a slower flash, with a period of 2 seconds, leading to a frequency of 0.5 hertz, demonstrating the inverse relationship between period and frequency.
The video explains that waves transfer energy through oscillations, with period being the time between waves and frequency being the number of waves per unit time.
Units for period are seconds, and for frequency, they are hertz, representing the number of waves per second.
A method for determining period and frequency from a wave diagram is outlined, emphasizing the importance of understanding axis labels.
A simulation is introduced to visually demonstrate the calculation of period and frequency, with a practical example of creating one wave.
The period calculated from the simulation is 0.67 seconds, and the frequency is determined to be 1.5 hertz by observing the clock and wave count.
A mathematical approach to converting period to frequency is provided, using the example of a period of 0.67 seconds resulting in a frequency of 1.5 hertz.
The video presents a problem-solving scenario, guiding viewers on how to use graphical representation to calculate period and frequency.
A step-by-step explanation is given on how to find the period by identifying one wavelength and the time between peaks.
Once the period is known, the frequency can be easily calculated by taking the reciprocal, as demonstrated with a period of 20 seconds resulting in a frequency of 0.05 hertz.
The video concludes with a question to reinforce the learning objective, hoping viewers have understood how to use graphical representation to calculate period and frequency.
Transcripts
5.0 / 5 (0 votes)
Thanks for rating:


